Feature 6 Interactive Maps – Additional features
Distance Measurement and Spatial Analysis Tools
Maps are used in a wide range of activities and domains. Moreover, maps are helpful in various purpose and numerous projects can benefit from the advantages of maps. If in the past, static maps were used for different spatial analysis and decision-making processes, nowadays interactive maps provide even more benefits for those who need to develop spatial analysis, spatial comparisons and distance measurements. Due to the need of different features, while using digital maps and interactive maps, here at CSV2GEO we have developed some more additional features for the users who choose our “Interactive Maps” tool.
One of these features is called “Map Circle” and it can be found in the table of contents, under the “Security” menu. This feature allows the user to create circles around different markers plotted on the map. The user can choose to create two circles and the user can select the desired radius for both two circles.
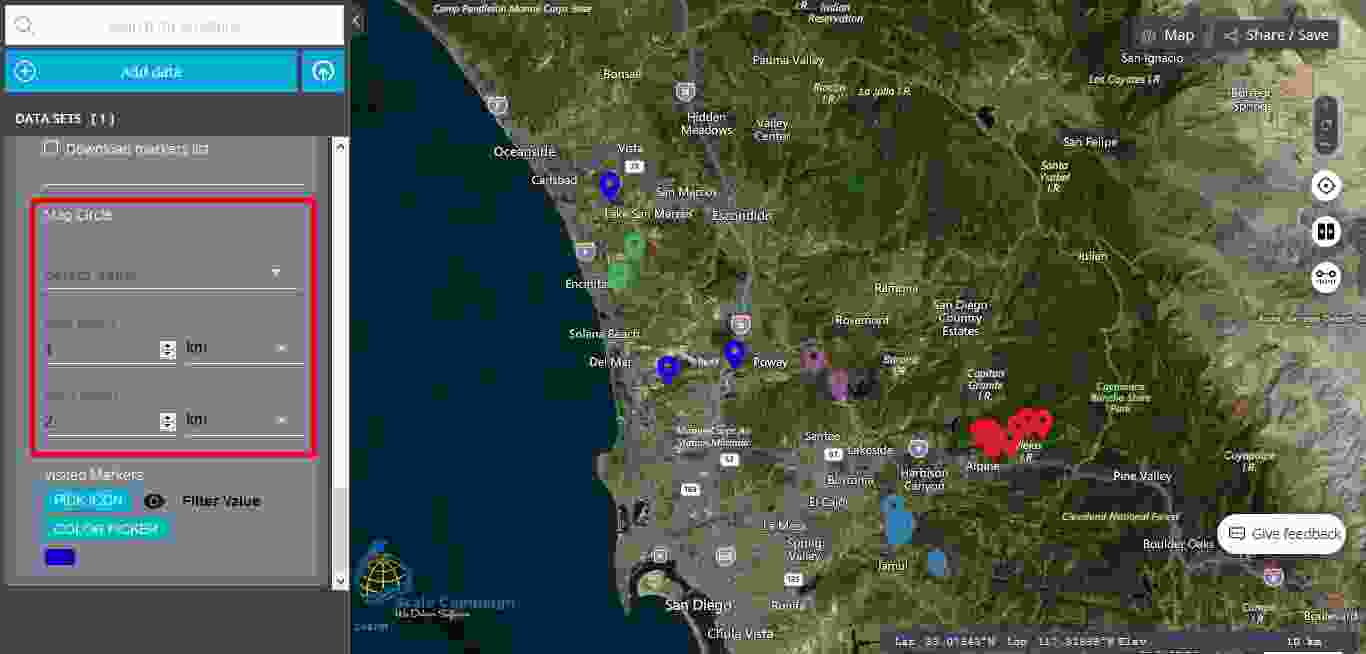
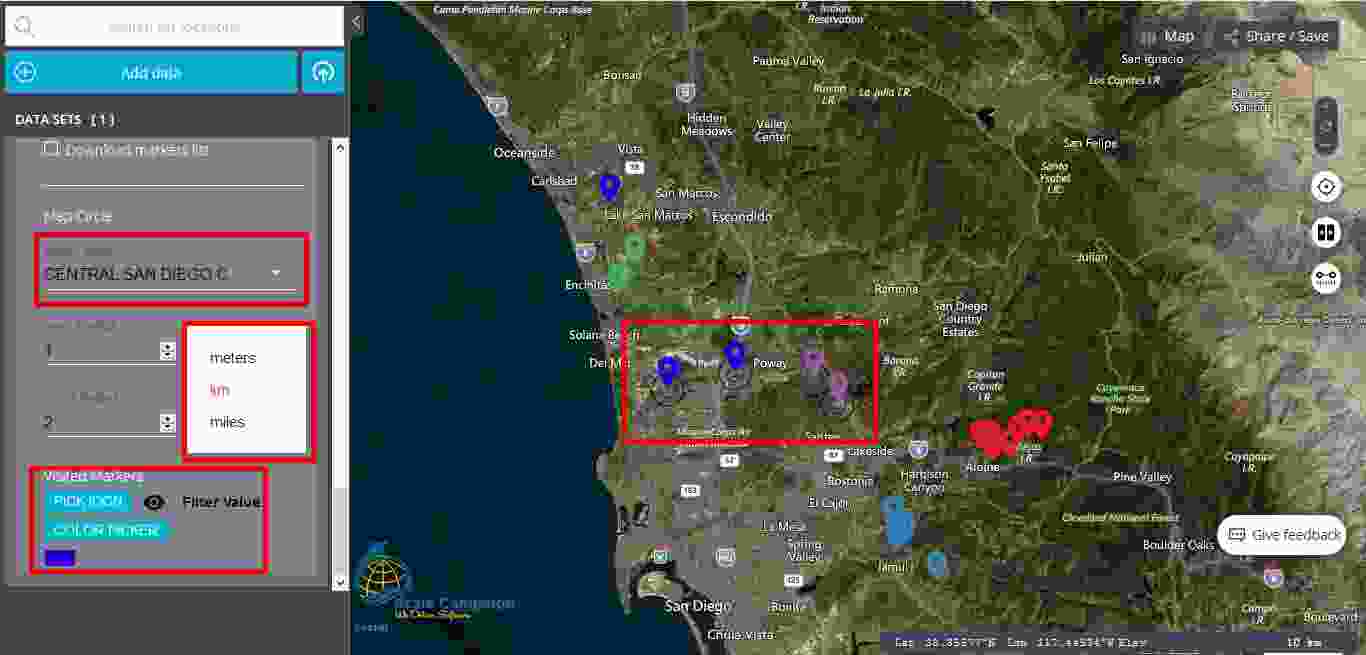
The first step in using “Map Circle” feature is to select the value around the circles those will be drawn. In order to this, the user should click on the field “Select Value” and choose one value from those available. It should be mentioned that the value is based on the selected column in the “Group by Column Value” menu available in the table of contents. As soon as the user has selected a certain value, around the markers plotted on the map fitting in that category value two circles will be drawn. The user can choose the radius for both inner and outer circles. Moreover, the user can choose the unit measurement for the radius by selecting between miles, kilometers and meters.
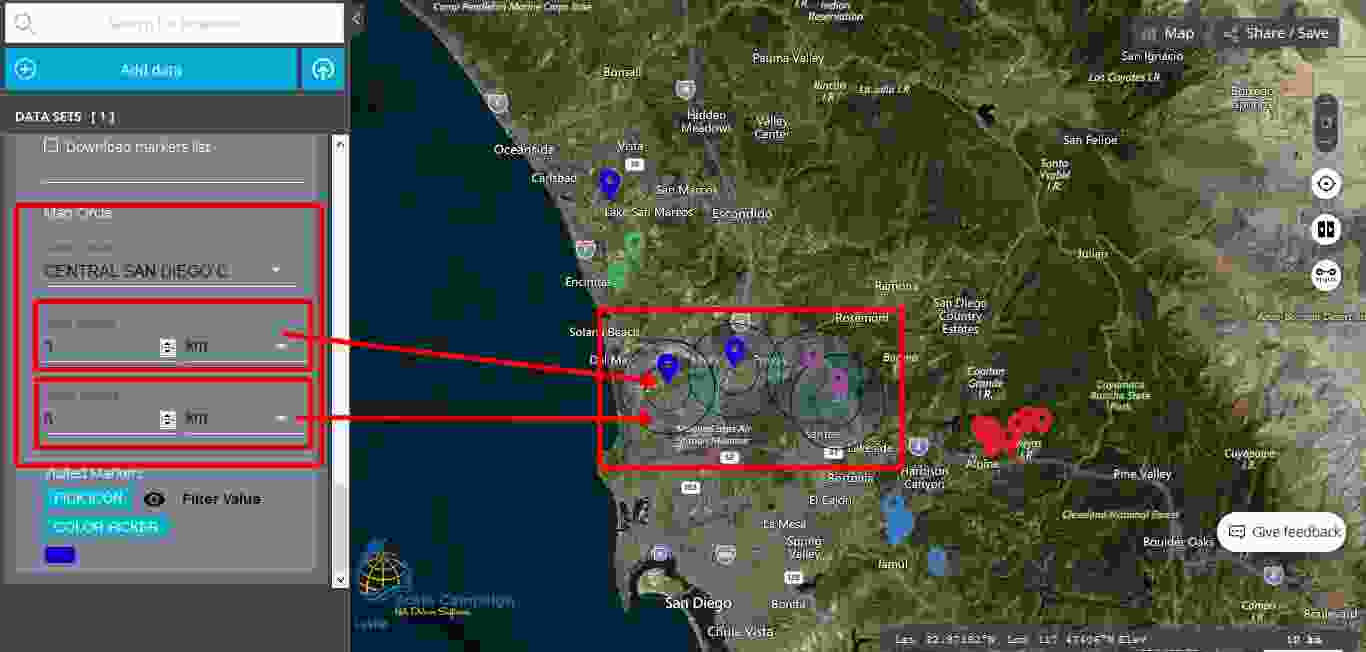
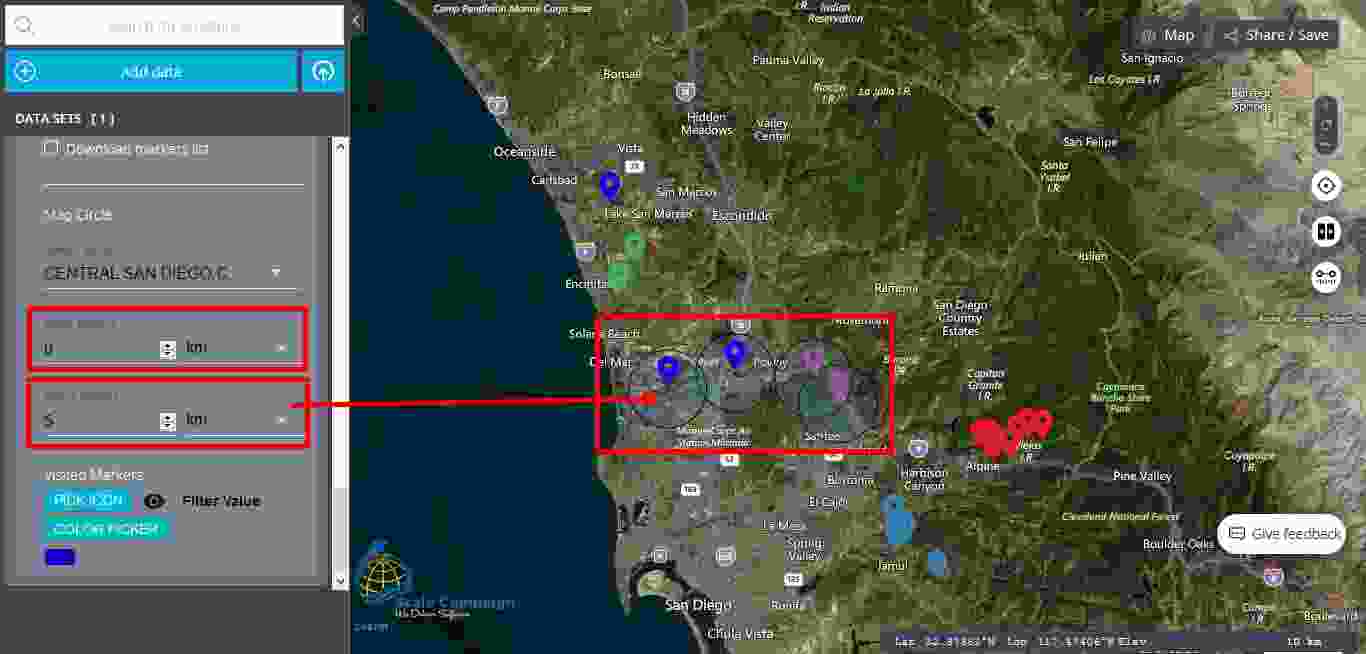
After the user decides the unit measure for the circle radius, the user should select the radius for the inner and outer circle. By doing this, the circle surrounding the selected markers will increase or decrease their surface, according to user’s need for the spatial analysis developed. Moreover, if the user does not need two circles, then one of the radiuses can be set at zero and consequently only one circle will remain visible on the map.
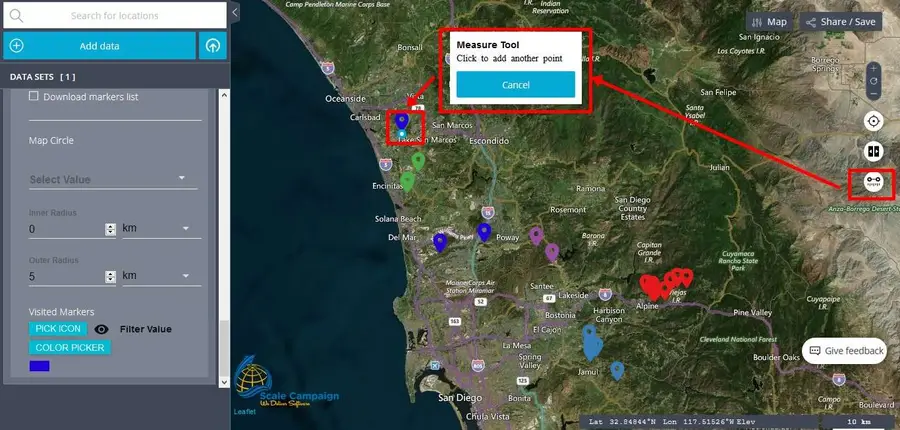
Besides the “Map Circle” feature, here at CSV2GEO we have implemented another great feature for different spatial analysis while using the “Interactive Maps” tool, namely the “Measure tool” feature. As it name says, this tool is helpful for those situations when the user needs to find out distance between different markers on the map. In order to use this feature, the user should take a look on the right side of the map. The user will notice three circles (buttons) and the most down of these buttons is the “Measure tool” feature. As soon as the user clicks on the “Measure tool” button, a small window opens and the user should click on the marker representing the starting point for the measurement operations.
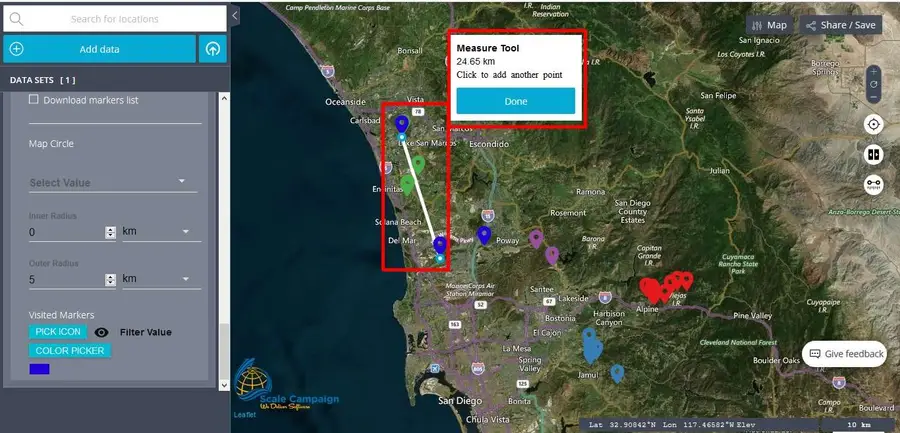
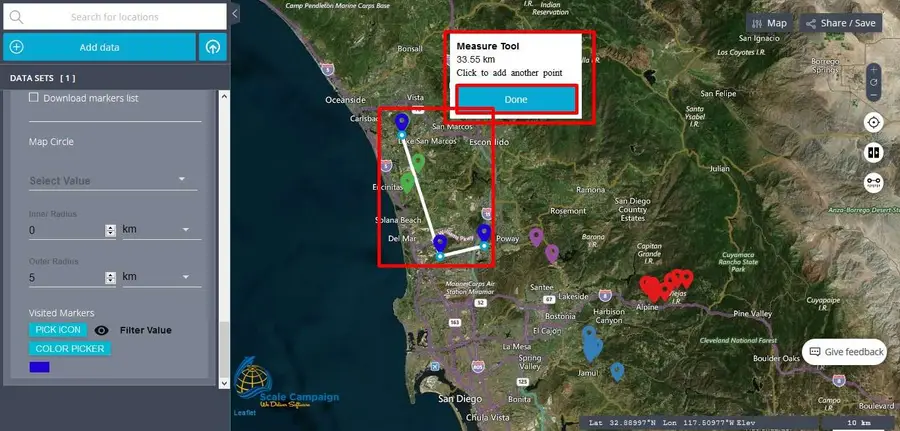
As soon as one marker on the map is selected the user can click on the next point and then so on until the user clicks all the markers representing user’s points of interest for this measurement. The distance is shown on that small new window opened after clicking on the “Measure tool” button and as soon as the measurement operations are completed the user, should click on “Done” button and measurements lines drawn over the map will disappear. This tool is very useful for those situations when the user needs to find out by using only few clicks the distance between two or more points of interest on the map.
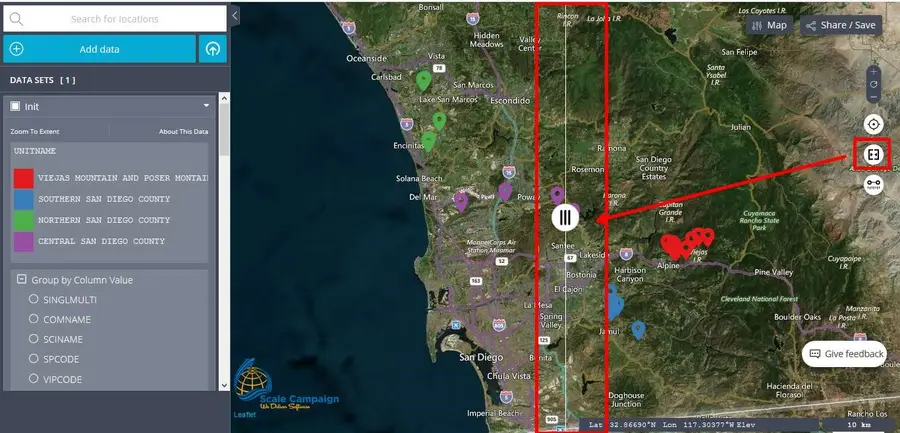
Additionally, above the “Measure tool” button the user can notice another button named “Enable side-by-side comparison”. When selecting this tool the user will notice that the map display is spread in two parts and the user can drag that line in order to compare two different data sets. Consequently, for those situations when the user has the same events, features or phenomena to compare, the user can benefit from this great tool in order to compare over the same map two or more different data sets.
Concluding, here at CSV2GEO the interactive mapping tool offers a wide range of features and tools for those users who decide to create maps using the geocoded data previously geocoded here at CSV2GEO. Consequently, any users should benefit from all the features available under the “Interactive Maps” tool. A large variety of maps, spatial analysis and spatial representations can be created by using this “Interactive Maps” tool.