Interactive Map Markers Guide - Part I
Customizing Icons and Filtering Map Markers
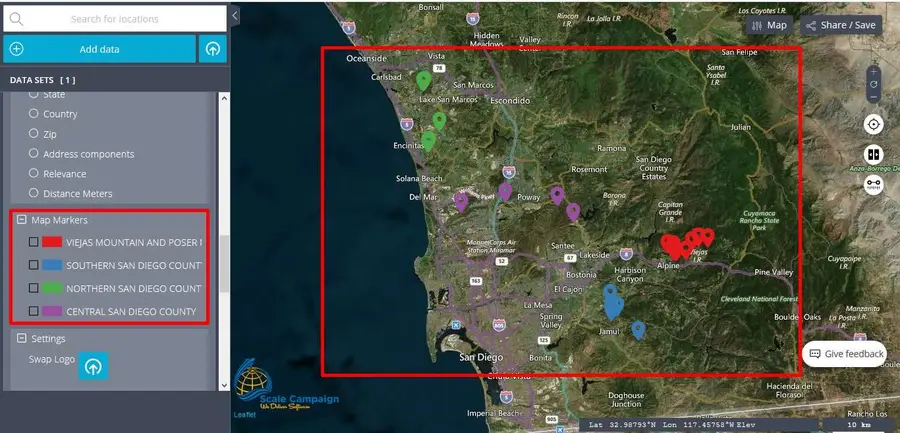
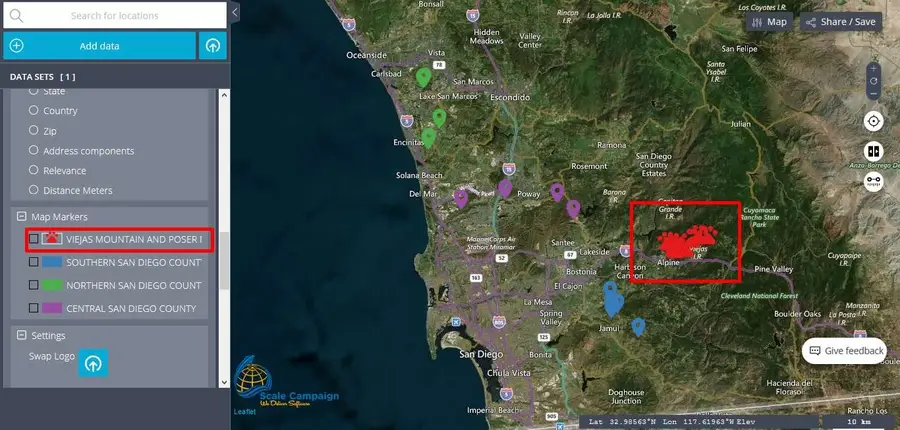
At CSV2GEO the „Interactive Maps” tool tries to provide as much functionality as possible for the users in order to help them to create complex interactive maps, but also great maps ready to be shared or printed. In order to achieve this goal, at CSV2GEO we have implemented the menu „Map Markers” in the table of contents of the “Interactive Maps” tool. In other words, after the user chooses to click on the button „Map It” after the data have been geocoded or reverse geocoded, that data will be plotted on the map and the user can scroll down the table of contents until „Map Markers” menu show up.
However, it is important to point out that in the „Map Markers” menu the user will notice different colors and values. These characteristics are based on the column value chose in the above menu, namely the menu „Group by Column Value”. Consequently, when the column value is changed in this menu, the names and colors in the „Map Markers” menu will also change. Actually, the markers are those points displayed on the map showing the locations of the geocoded data. Consequently, depending on user’s needs, the user can choose to represent those markers using different icons and also the user can filter those markers using value as criteria.
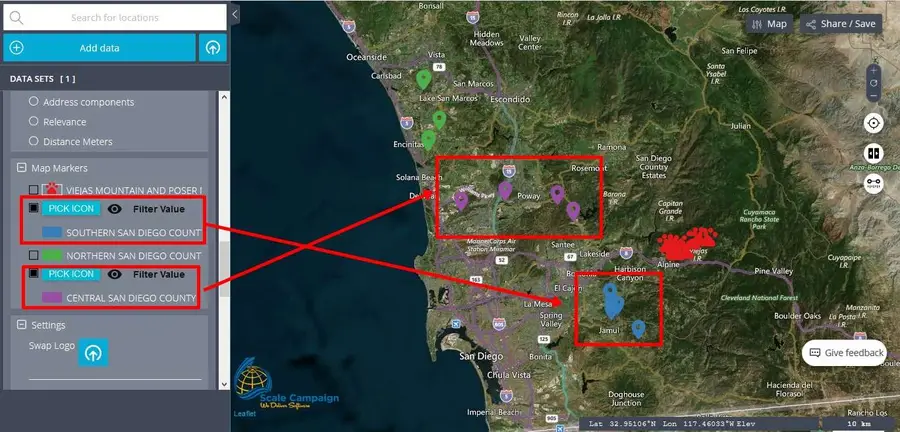
Going further, it should be highlighted another functionality available in the “Interactive Maps” tool here at CSV2GEO, namely the possibility to change the icon for each markers category. Consequently, the user should choose one category of markers available in the “Map Markers” menu and then the user will notice a “Pick Icon” field.
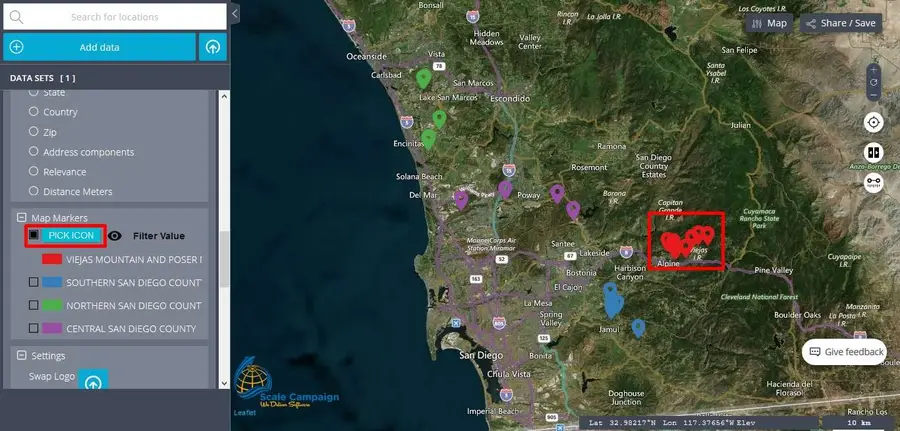
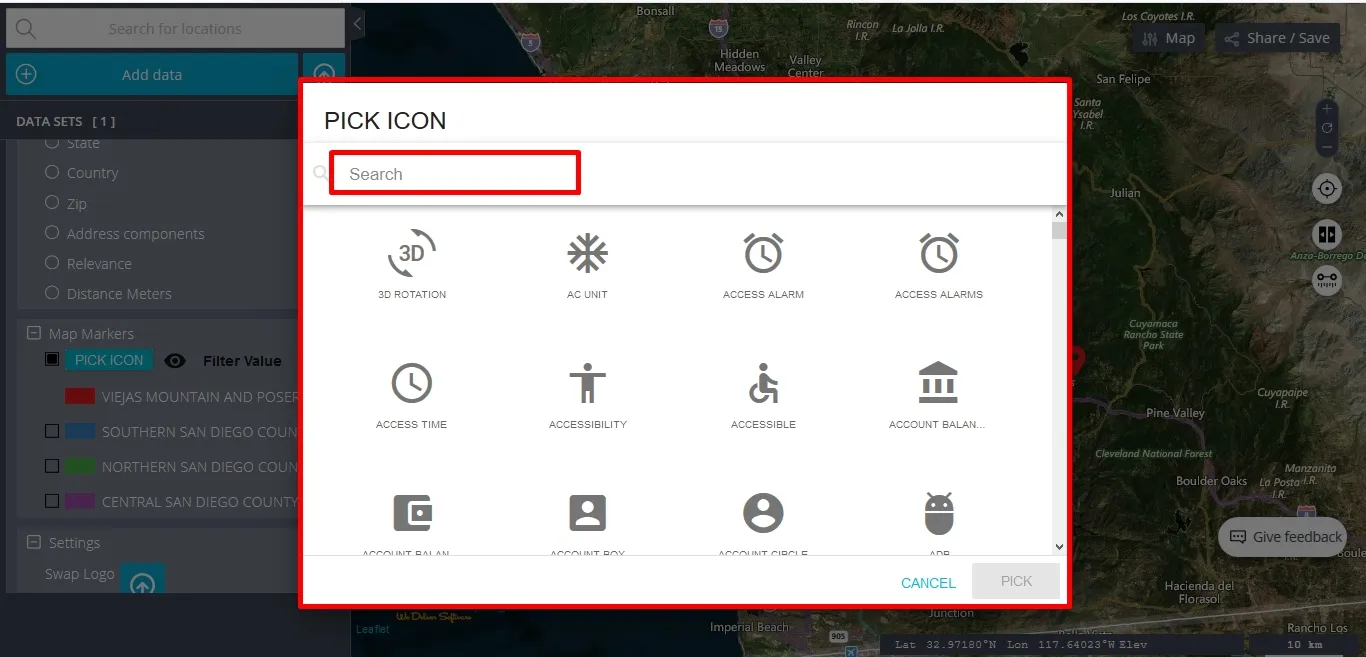
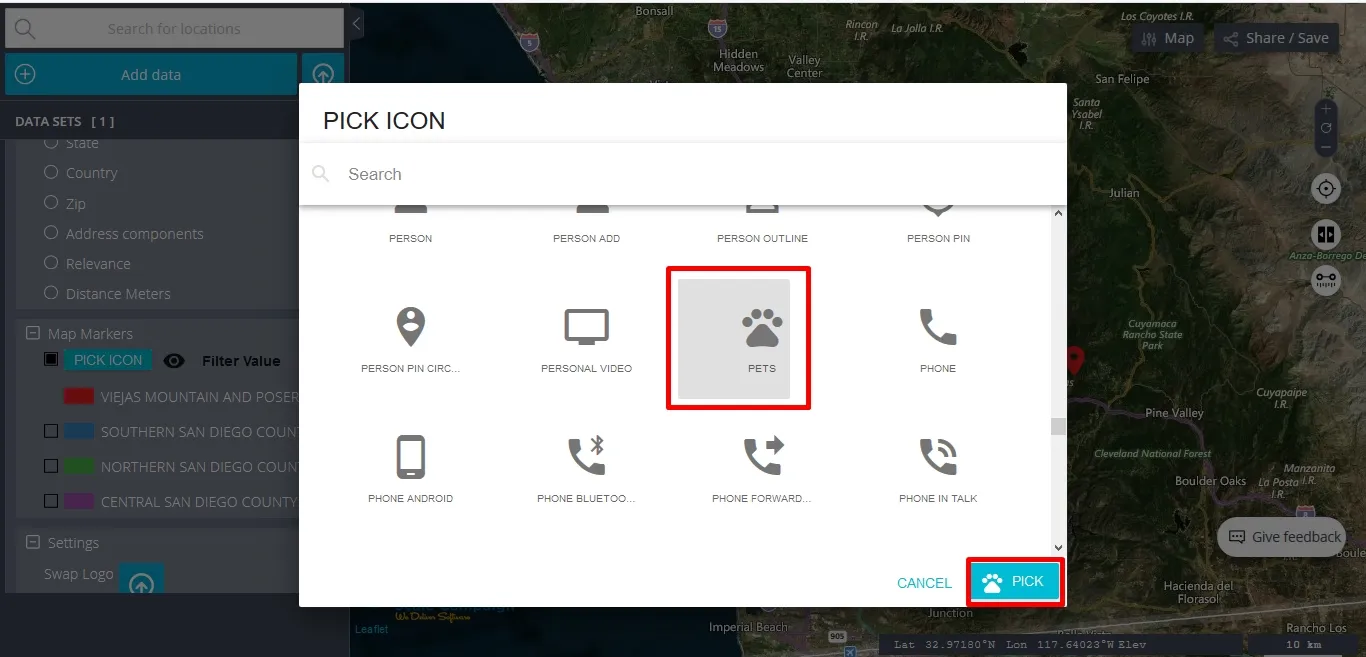
By clicking on that “Pick Icon” button a new window with different icons will open and the user can choose a different icon from a large library of icons for that category of selected markers. The user can take a look at the available icons in the library or the user can use the button “Search” that is available there, in order to find faster an icon. As soon as the user will choose a different icon from the default one by clicking on the “Pick” button in the new opened window, the icon will change on the map, but also in the “Map Markers” menu in the table of contents.
Besides this pick icon feature available in the “Interactive Maps” tool here at CSV2GEO, under the “Map Markers” menu the user can benefit from one more feature, namely “Filter Value”. First of all, the user should check on the desired categories of markers and then near the “Pick Icon” feature the user will notice “Filter Value” feature and an icon like an eye. When that eye seems to be opened, the markers are visible on the maps. On the other hand, if the user will click on those buttons similar with an eye, then the markers will become invisible on the map. Moreover, the symbol for those invisible markers will become the eye symbol crossed by a line. In order to become visible again, the user should click again on the eye symbol and the markers are displayed back on the map.
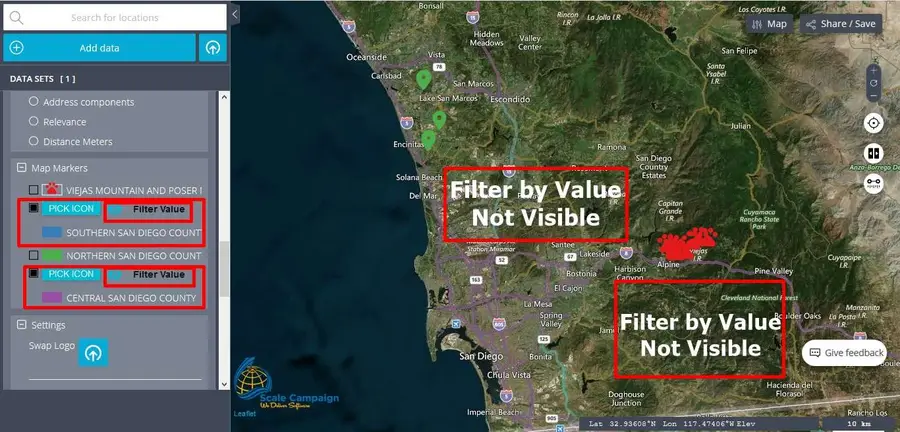
Both “Pick Icon” and “Filter Value” features are very useful and can be really helpful during mapping process. Moreover, since the user can require representing in different ways the markers plotted on the map, the “Pick Icon” feature is a great option. Furthermore, by applying the “Filter Value” tool, the user can choose which markers remains visible and which of them will not be visible. More map markers features can be found and use to unitlize additional functionlities. Consequently, different maps can be produced by using the same geocoded data sets only by applying different features implemented in the “Map Markers” menu in the “Interactive Maps” tool. By having such great features available at CSV2GEO mapping may become easier even for people without a rich knowledge in cartography or GIS.