Feature 3 GIS – Geovisualization
Advanced Spatial Visualization Techniques
Maps are used since old times in a wide range of domains. Following the computational progress, maps have migrated from paper maps into digital maps. Even if maps are still used nowadays as paper maps, more and more people choose digital maps in different applications. However, digital maps have been developed after the implementation of Geographic Information System (GIS), after the 90’s. Starting from that time GIS has constantly developed and new techniques were implemented in order to obtain better maps, more complex spatial representations and maps closer to the real world. Consequently, the field of Geovisualization has been developed and starting from 1995 it is an official domain of the International Cartographic Association (ICA).
Geovisualization is the domain that uses different techniques and methods from digital cartography, scientific visualization, GIS, scientific visualization and image analysis in order to present different types of geospatial data, to provide spatial analysis tools and to create real world phenomena models closer to reality, such as 3D representations or virtual globes. Spatial representations obtained using Geovisualization are aimed to enhance spatial thinking and to provide alternative ways of the real world representations, more than classic 2D maps.
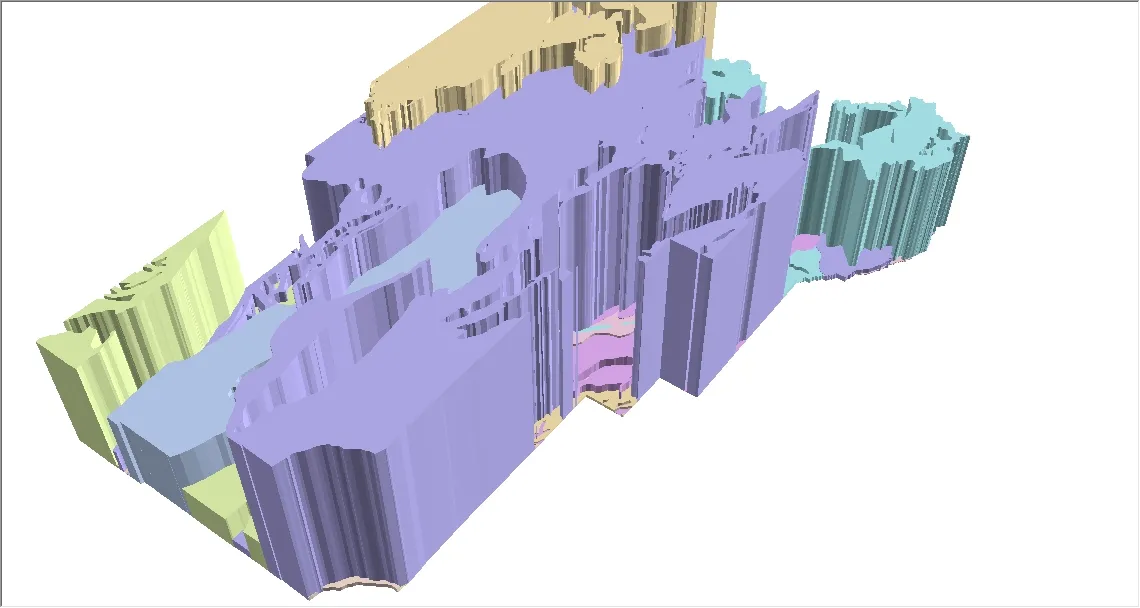
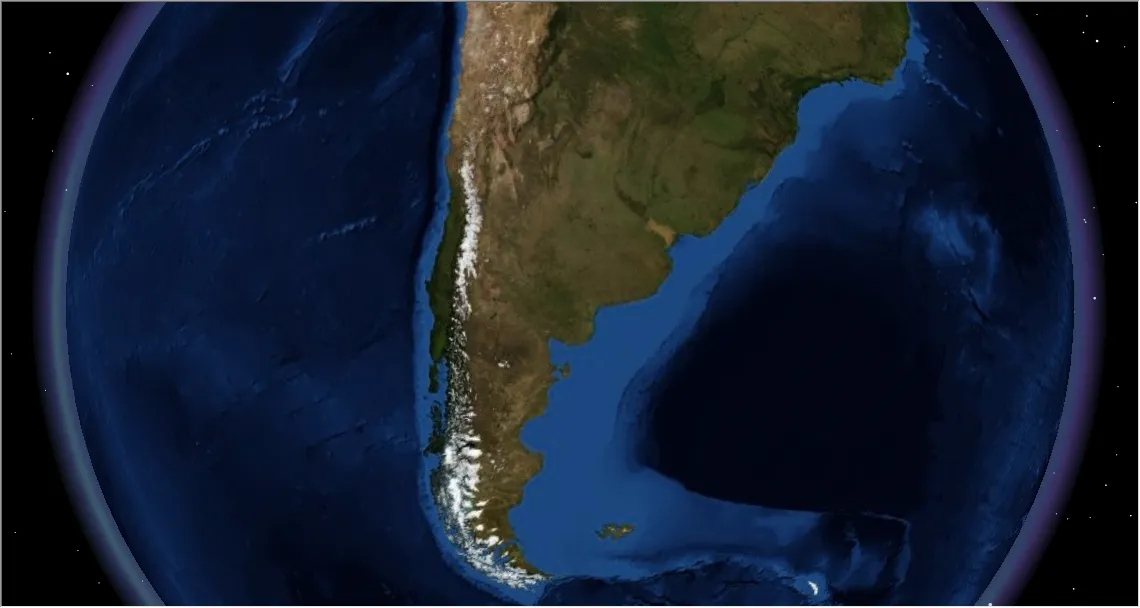
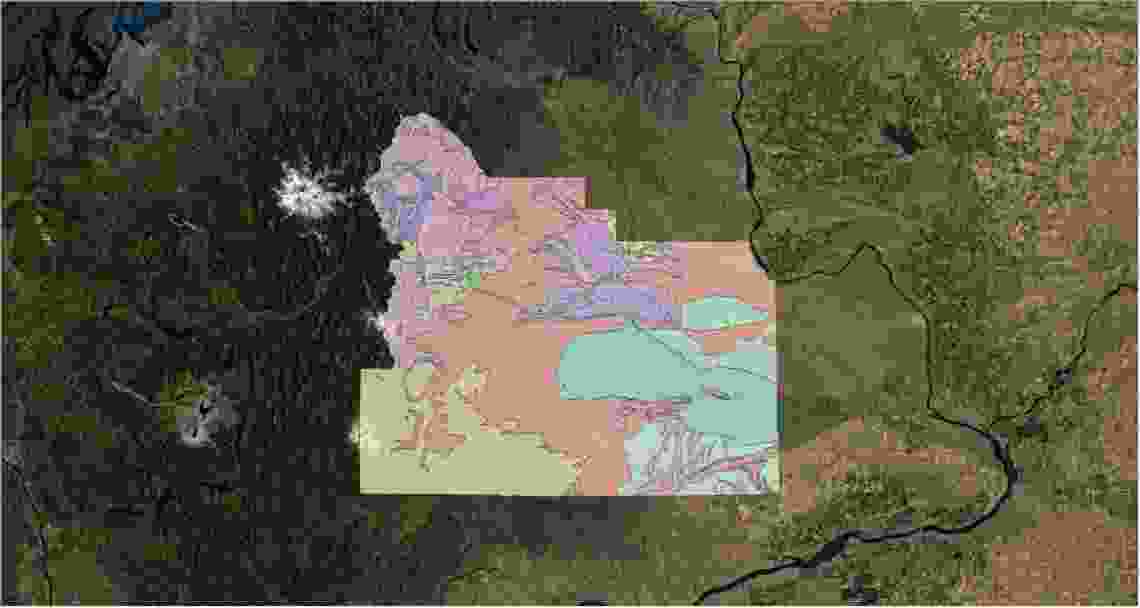
Furthermore, in most of situations data used in Geovisualization is primary produced or obtained in GIS environment. Consequently, Geovisualization is a GIS-based tool and these two are strongly related. Conversely, here at CSV2GEO our GIS experts are available to help you in the field of Geovisualization. Each project in GIS and Geovisualization is different and based on this statement at CSV2GEO you have the opportunity to complete an order form regarding “Geovisualization”.
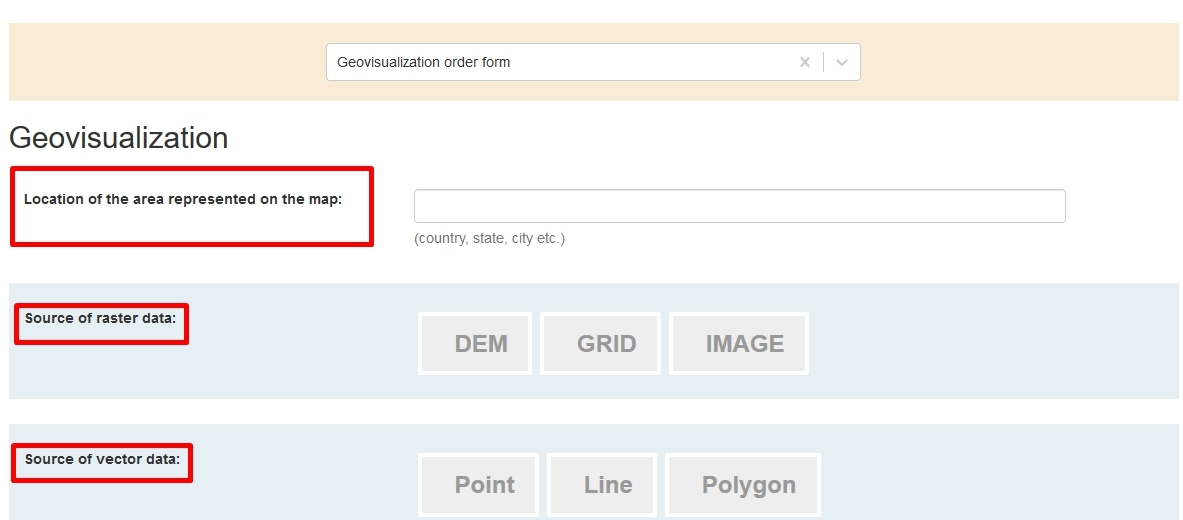
This order form is available under the GIS menu and when the user selects “Geovisualization order form” more fields appear on the screen.
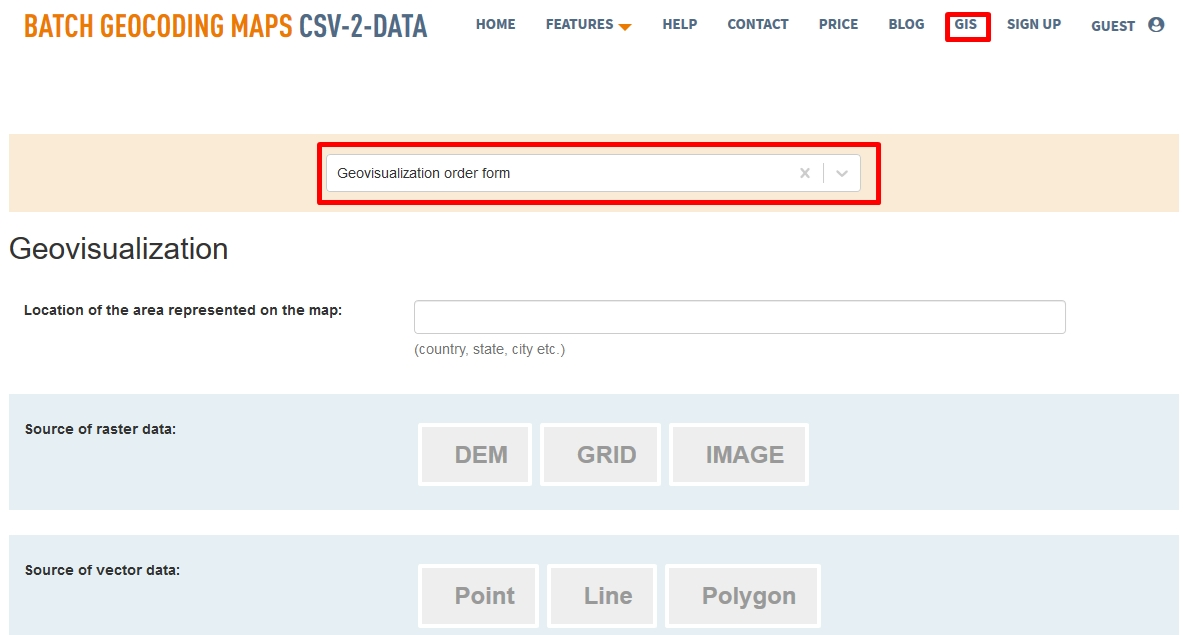
The first field that requires to be completed is related to the location of the study area, followed by two fields regarding data source: raster and vector. Sometimes a project may use both vector and raster data, but other projects might use only vector data or raster data. Moreover, the type of data for both vector and raster is important.
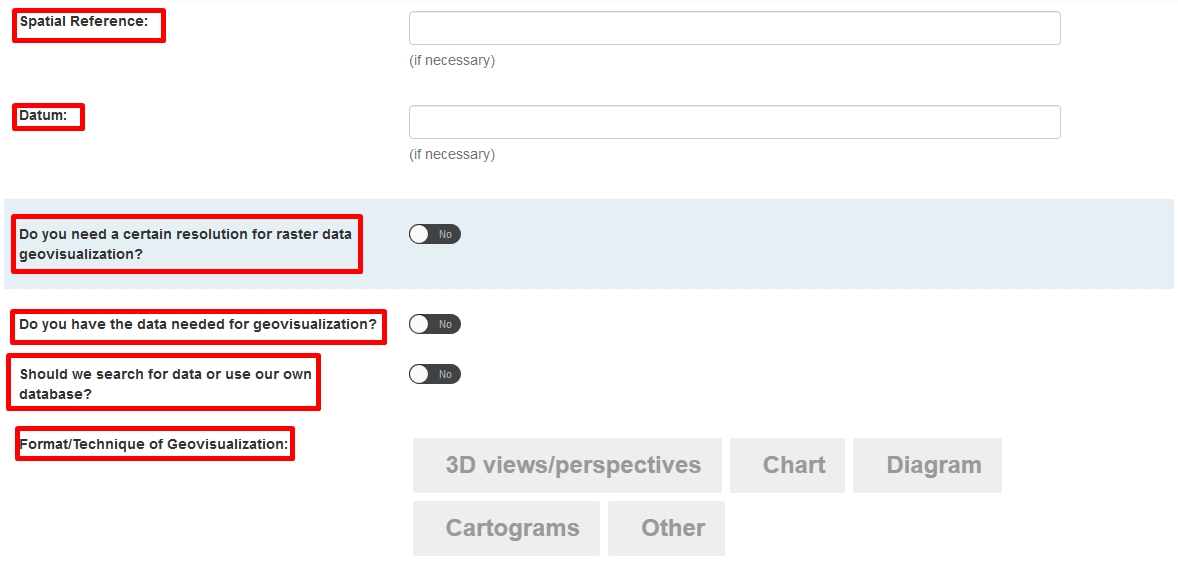
If in GIS projects spatial reference is usually mandatory, in Geovisualization projects this aspect could not be necessary all the time. Consequently, the user can add details regarding spatial reference and datum, but only if these details are necessary. Furthermore, details regarding resolution for raster data are asked, but also if the data necessary for the Geovisualization process are available from the user or GIS experts at CSV2GEO should provide the data. Moreover, the format or technique of Geovisualization is required and this aspect is highly important in order to know exactly how the final product should look like.
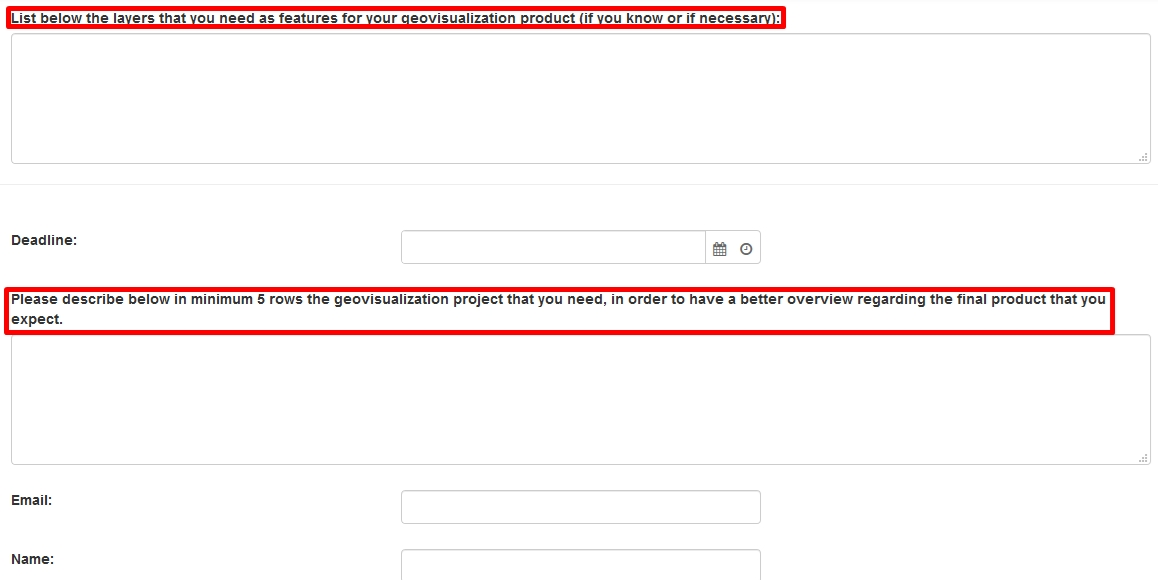
At the end of this order form, user should add other details if the user considers necessary. First of all, a list of layers needed in the Geovisualization product may be helpful for CSV2GEO experts to know exactly the data needed for such a project. Moreover, a brief description of the project can be helpful for our team to reach user’s expectations regarding a certain Geovisualization project.
A wide range of real world features and phenomena can be better explained and represented from a spatial perspective by using Geovisualization techniques and methods. If you consider that plain maps (both paper and digital) are not enough representative for your project and you consider that Geovisualization is exactly what you need, do not hesitate to contact our team of experts at CSV2GEO and complete the “Geovisualization” order form to help us understand your project requirements. In addition, you may need Surface analysis or Georeferencing. Our GIS experts are ready to use the skills and expertise in both GIS and Geovisualization in order to deliver the result that you expect by using different Geovisualization techniques and methods.