Feature 2 Interactive Maps – Group data, zoom to extent
Grouping and Zooming Geocoded Data on Maps
After the user has obtained the geocoded results, the user can choose to display the data on an interactive map that is available at CSV2GEO.
By using this tool , the user is able to create custom maps according to user’s requirements and expectations. As soon as the data is geocoded, the user can click on „Map it” button and then a new window is opening with the locations plotted on an interactive map. The user will observe the map of the world and will notice where the locations previously geocoded are displayed on the Earth surface.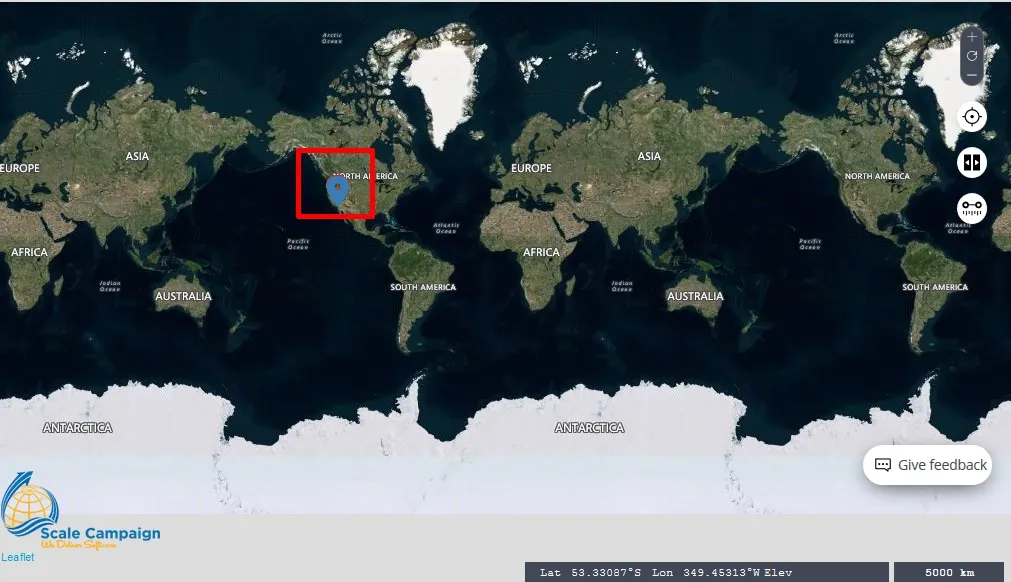
Even if knowing where the points are displayed at the scale of the entire world may be interesting, most probably this would not be very helpful. Consequently, the user should zoom in the location of the geocoded results. In order to be sure that the entire area with the geocoded data will be displayed on the computer display, the user should click on the “Zoom to Extent” button, which is situated in the left side of the table of contents in the “Interactive Maps” tool. As soon as the user clicks on the “Zoom to Extent” button, the map will show exactly the locations for the geocoded locations. Moreover, the scale of the map will fit in order to plot on the map all the locations. This is a great advantage since the user can utilize just a single click in order to zoom exactly to the area of interest. Moreover, by using this “Zoom to Extent” button, the user will be able to observe also the neighborhood areas, which are extremely important in each spatial analysis.
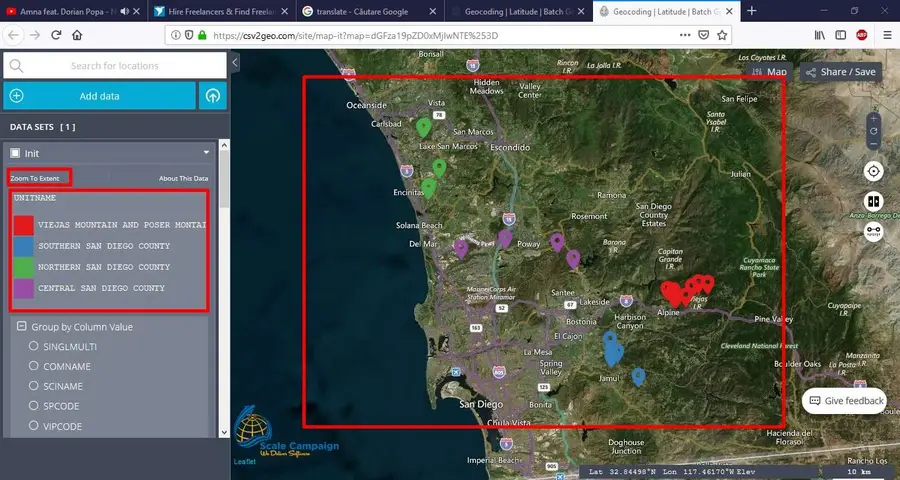
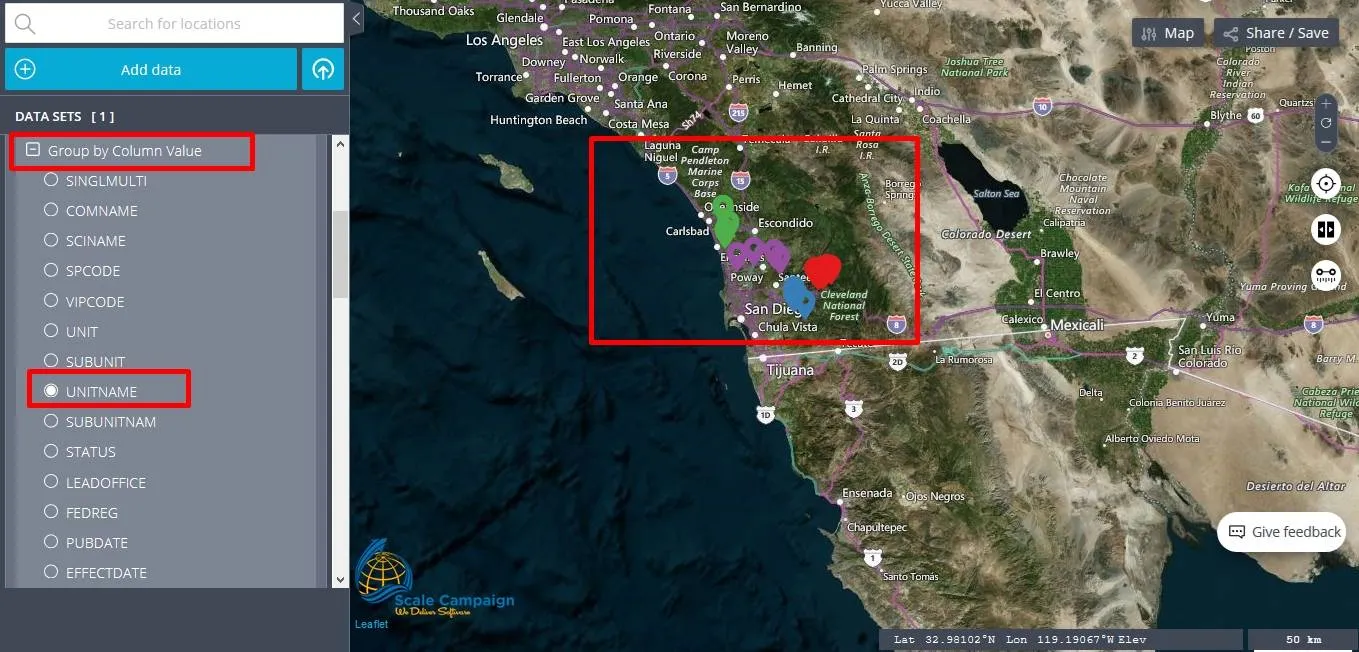
As soon as the user is able to observe the data plotted on the interactive map using this tool in CSV2GEO, the user can perform different operations with the data in order to develop several analyses. Consequently, the user can group the data based on the diverse attributes available in the CSV file used for geocoding or reverse geocoding process. In order to group the data, the user must see the menu “Group by Column Value” on the left side, where the “Table of contents” is available while using the “Interactive Maps” tool. Under the “Group by Column Value” the user can choose the parameter to group the values displayed on the map. By doing this operation, the user can facilitate the spatial analysis by a wide range of values or attributes. In the image below we will group the geocoded data based on the column “UNITNAME” and the result will be the spatial representation of the data in four different colors: green, blue, red and purple.
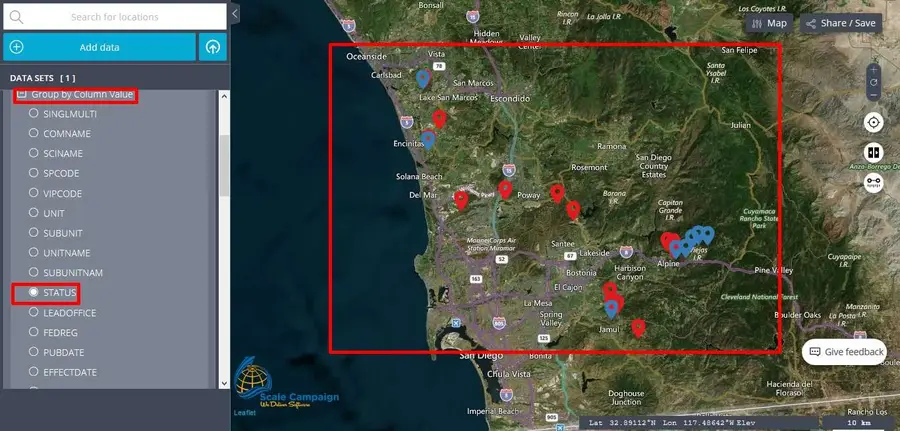
Additionally, we will select another column value, namely “Status” as can be observed in the image below. Consequently, the data will be now in only two colors, namely blue and red. Actually, the user has now a new different map where the data shows the status of the features represented on the map, instead of showing the unit name, as in the previous example.
Moreover, since here at CSV2GEO the “Interactive Maps” tool allows the user to save the map for both print or digital format sharing, the user can group the data based on a wide range of values and create one map for each value. This functionality is a great advantage since both printed and digital maps can be used in various ways in different reports, projects and institutions. As you can see, the “Interactive Maps” tool makes from CSV2GEO more than only a geocoding tool since the user can benefit from a wide range of functionalities implemented in this mapping tool. Don’t hesitate to use the “Interactive Maps” tool in CSV2GEO whenever you might need to run geocoding and reverse geocoding process followed by mapping process. Here at CSV2GEO all processes implemented are user-friendly and customizable.