How to Embed Interactive Maps in Articles & Blogs
How to embed interactive maps in blogs and websites. Geocode addresses, download maps, and embed with iframe on any platform.

A static map screenshot is a dead end — readers can’t zoom, pan, or click individual locations. Interactive maps transform flat content into explorable experiences where readers engage with your data directly. They increase time on page, reduce bounce rates, and convey geographic information far more effectively than any table or list ever could.
This guide walks you through the complete process: geocoding your addresses to get coordinates, generating an interactive map, getting the embed code, and placing it in your website or blog — regardless of what platform you use. No coding required for the basic workflow, with code examples for developers who want more control.
Why Interactive Maps Beat Static Images
| Feature | Static Image | Interactive Map |
|---|---|---|
| Zoom | Fixed resolution — zooming pixelates | Infinite zoom with crisp detail at every level |
| Pan | Shows only one area | Readers explore the full dataset |
| Click | No interactivity | Click pins to see address details |
| Mobile | Small and hard to read | Pinch-to-zoom works naturally |
| Data density | Cluttered with 20+ pins | Clusters auto-group and expand on zoom |
| SEO | Alt text only | Embedded content with structured data |
| Accessibility | Screen readers see alt text | Keyboard navigation, ARIA labels |
For content with geographic data — store locations, event venues, research sites, travel itineraries, delivery zones — an interactive map communicates what paragraphs of text cannot. Studies show that interactive content increases average session duration by 30–50% compared to static alternatives. For data-driven articles and business pages, embedded maps are among the highest-engagement elements you can add.
Step 1: Geocode Your Addresses
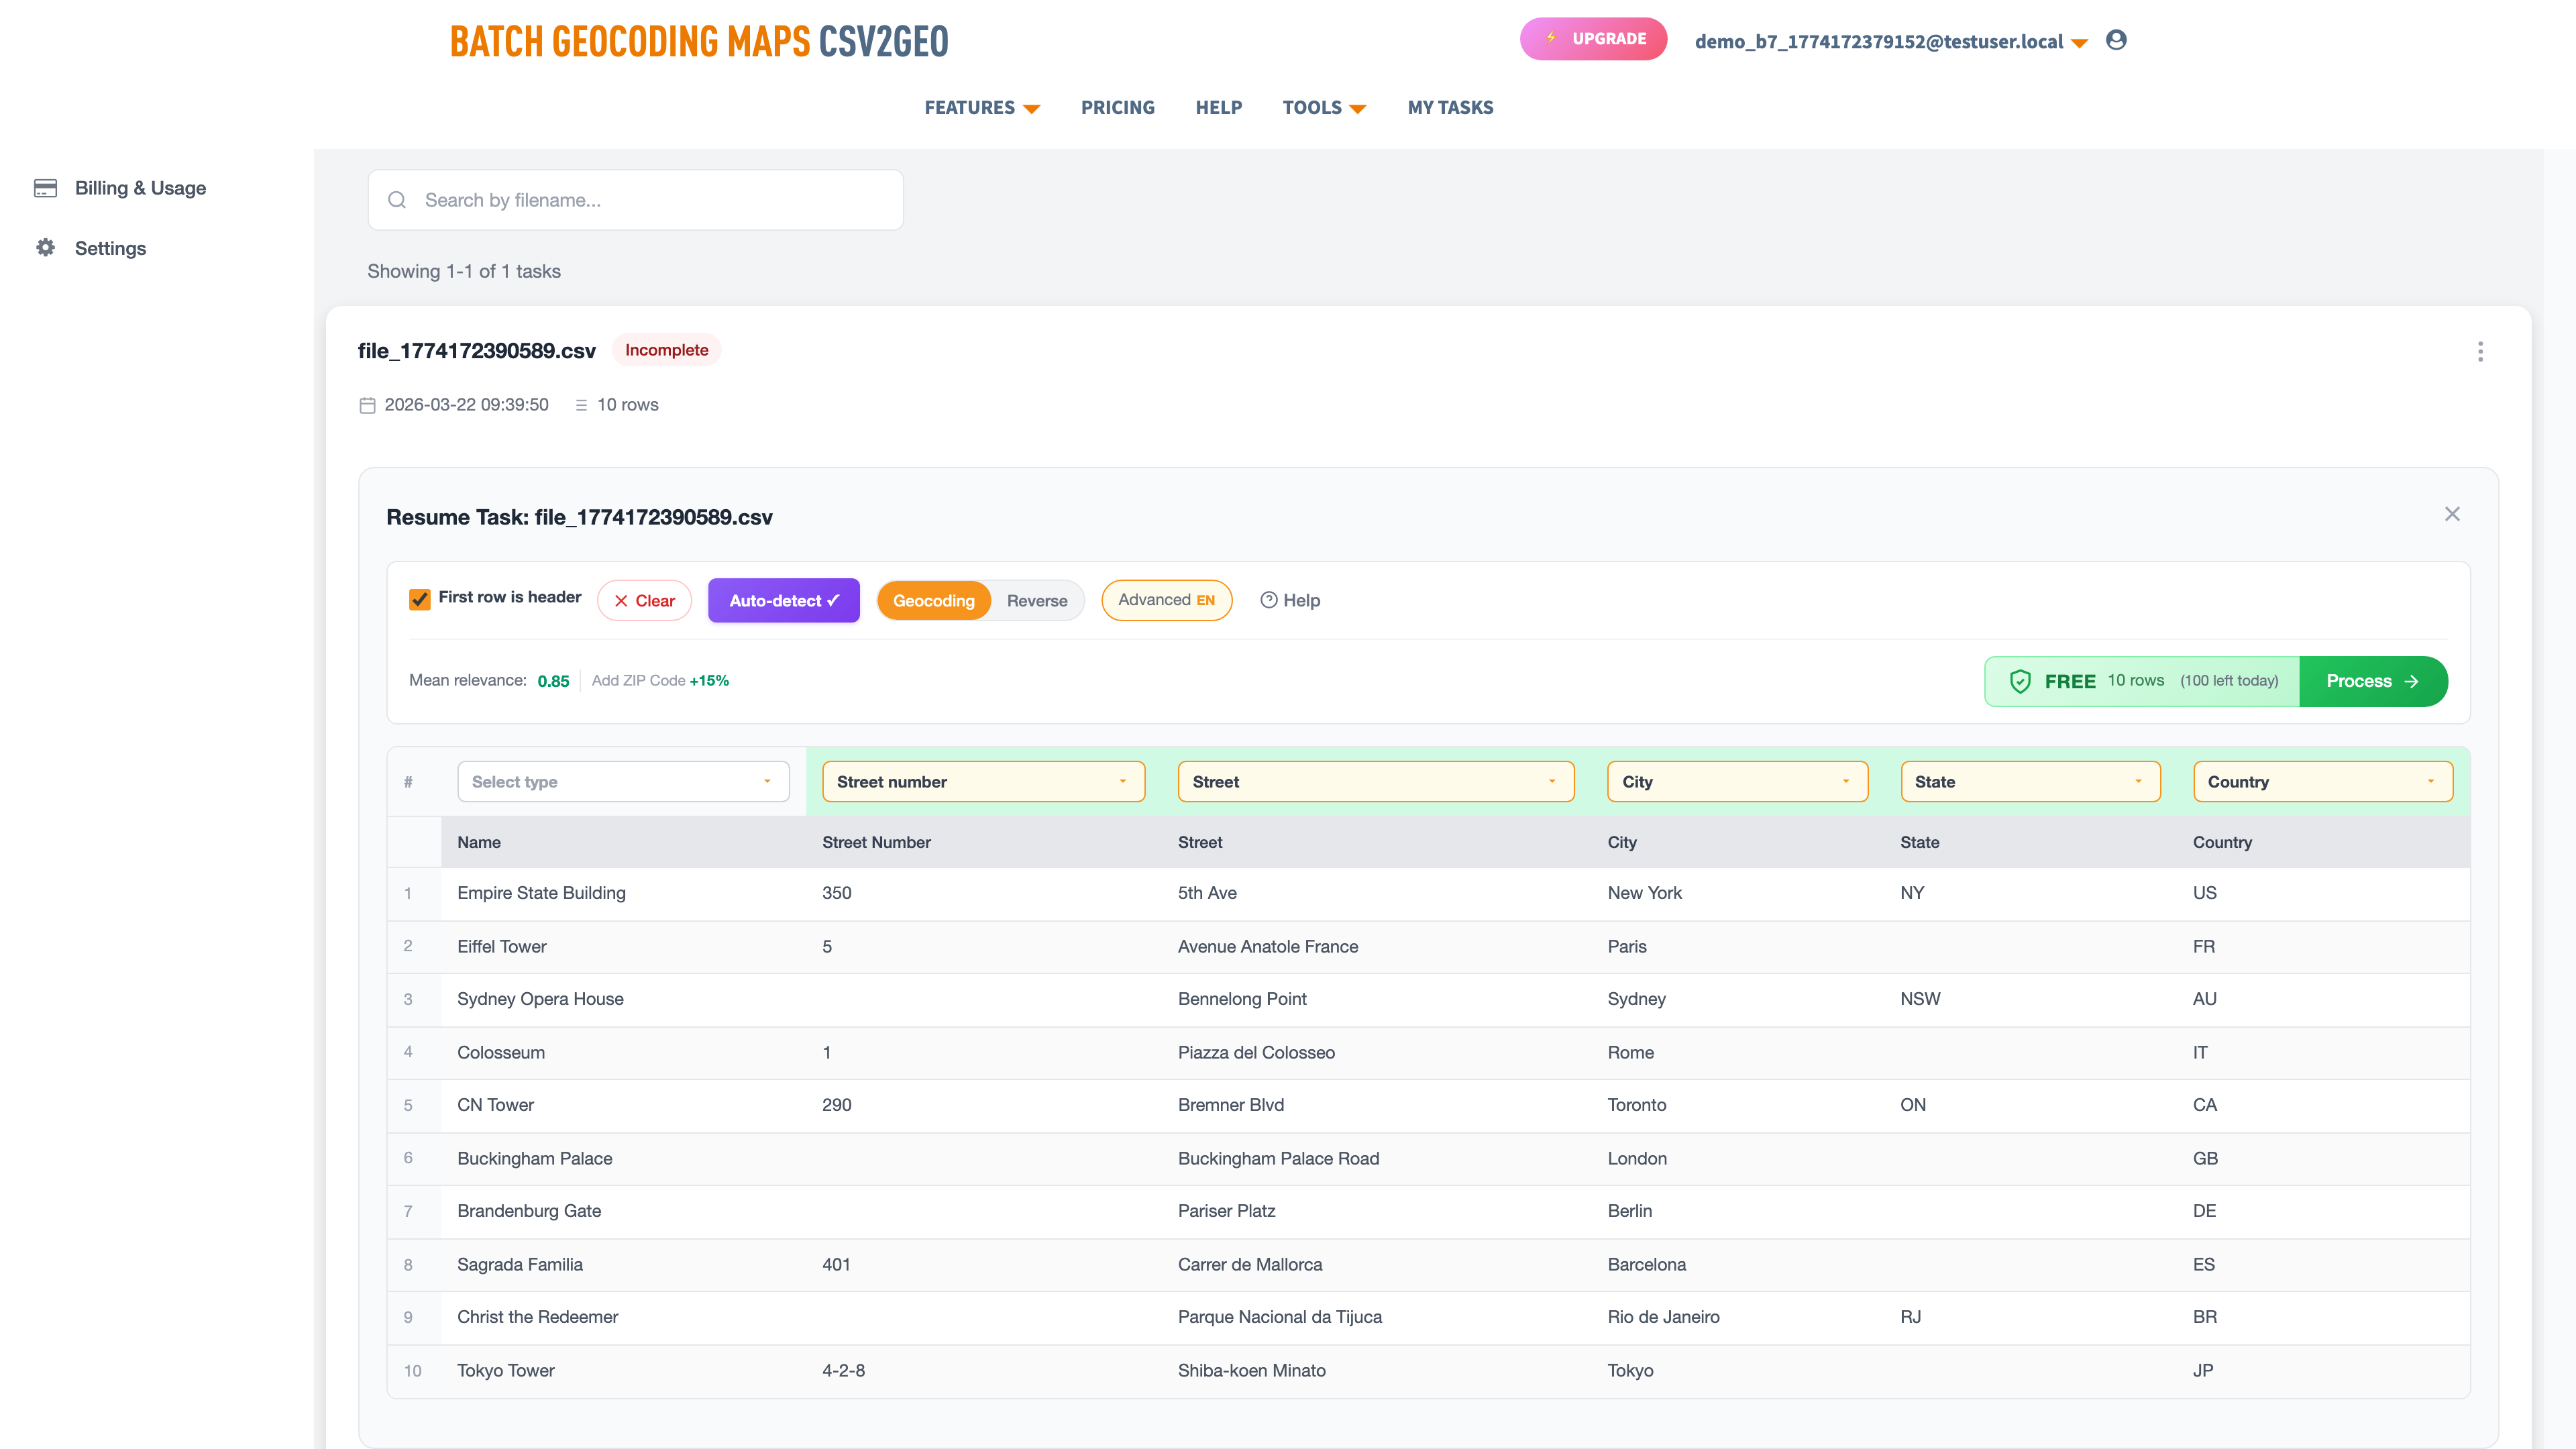
Before you can create a map, you need coordinates. If your data has addresses but no latitude/longitude values, you need to geocode them first.
- Prepare a CSV or Excel file with your addresses. Separate columns for street, city, state, postal code, and country produce the best results.
- Upload to csv2geo.com/batchgeocoding. The AI auto-detects your columns.
- Preview the first 10 results. Verify column mapping and check that pins appear in the correct locations.
- Process the full file. 100 rows per day free.
CSV2GEO covers 200+ countries with 461M+ addresses. Urban addresses typically return rooftop-level accuracy (relevance 0.95–1.0). For details on preparing your address data, see our geocoding tips guide.
Step 2: Download Your Map
After geocoding, CSV2GEO generates an interactive map with all your geocoded points plotted. You can download this map as a standalone HTML file that includes all the pins, popups, and interactivity. No server required — it’s a single self-contained file.
- Click the "Download Map" button on your results page.
- The HTML file contains your map with all markers, zoom controls, and click-to-see-details popups.
- Open it locally in any browser to verify it looks correct before embedding.
Step 3: Get the Embed Code
To embed the map in a website or blog, you need to host the HTML file and reference it in an iframe. The simplest approach: upload the HTML file to your own server or a static hosting service, then use an iframe tag to embed it.
The iframe code:
Anatomy of the embed code:
- src: The URL where your map HTML file is hosted.
- width="100%": Makes the map responsive — it fills the container width.
- height="500": Sets the map height in pixels. 400–600px works well for most layouts.
- loading="lazy": Defers loading until the map scrolls into view. Improves page speed.
- title: Describes the map for screen readers and SEO.
- style="border: none": Removes the default iframe border. Add border-radius for rounded corners.
Step 4: Embed in Your Platform
| Platform | How to Embed | Notes |
|---|---|---|
| WordPress | Add a Custom HTML block, paste the iframe code | Works in both Classic and Block editor. Some security plugins may strip iframes — whitelist your domain. |
| Squarespace | Add an Embed block, paste the iframe code | Use the "Code" option, not "URL." Squarespace sanitizes HTML so use their embed block specifically. |
| Wix | Add HTML iframe element from the Add menu | Wix wraps iframes in its own container. Set the element height in the Wix editor to match your iframe height. |
| Shopify | Edit page HTML, paste iframe in a Custom Liquid section | Blog posts support HTML editing. Product pages may need a custom section. |
| Ghost | Add an HTML card, paste the iframe code | Ghost’s HTML card renders raw HTML without sanitization. |
| Webflow | Add an Embed element, paste the iframe code | Embeds only render in published mode, not in the designer. |
| Raw HTML | Paste the iframe directly in your HTML | No restrictions. Full control over styling and positioning. |
| React / Next.js | Use an iframe tag or dangerouslySetInnerHTML | Consider loading the map component directly for better performance. |
Responsive Design: Making Maps Look Good Everywhere
The default iframe width of 100% handles horizontal responsiveness, but height needs attention. A 500px tall map looks great on a desktop monitor but dominates the screen on a mobile phone. Consider these approaches for truly responsive maps:
- Fixed height (simplest): Use height="450" for a balanced default. Works well for most content.
- CSS aspect-ratio: Wrap the iframe in a container with aspect-ratio: 16/9. The map scales proportionally on all screen sizes.
- Media queries: Use different iframe heights for different breakpoints. 500px on desktop, 350px on tablet, 250px on mobile.
- Fullscreen option: Add a "View fullscreen" link that opens the map HTML directly. Readers on small screens can expand the map when they want to explore.
Test your embedded map on both desktop and mobile before publishing. What looks like a useful interactive element on a 27-inch monitor can become an awkward, hard-to-navigate block on a phone screen. The lazy loading attribute helps mobile performance by not loading the map until the reader scrolls to it.
Map Customization Options
The downloaded map file is standard HTML with JavaScript. Developers can customize it further:
- Pin colors: Change marker colors to categorize locations (red for stores, blue for warehouses, green for partners).
- Popup content: Edit the popup HTML to show custom fields — phone numbers, hours, images.
- Clustering: For large datasets (1,000+ pins), markers auto-cluster. Adjust the cluster radius for your data density.
- Bounds: Set initial zoom and center to focus on a specific region instead of fitting all points.
- Tile layers: Switch between street, satellite, and terrain base maps.
SEO Considerations for Embedded Maps
Search engines cannot crawl content inside iframes directly, but there are several ways to ensure your embedded maps contribute to SEO rather than being invisible.
- Use a descriptive title attribute on the iframe — this helps screen readers and provides context to crawlers.
- Add a text summary above or below the map describing what it shows. "This map shows our 47 retail locations across the northeastern United States."
- Include structured data (LocalBusiness schema) alongside the map for store locators.
- Add loading="lazy" to prevent the map from blocking above-the-fold content rendering.
- Keep the map file small. A map with 100 pins loads in under a second. 10,000 pins may need clustering to stay performant.
Hosting Options for Your Map File
The downloaded map HTML file needs to be hosted somewhere accessible via URL. Here are the most common options, from simplest to most robust:
| Hosting Option | Cost | Difficulty | Best For |
|---|---|---|---|
| Your web server | Included with hosting | Easy | WordPress, custom sites — upload via FTP or file manager |
| GitHub Pages | Free | Moderate | Developers. Push HTML to a repo, enable Pages. |
| Netlify / Vercel | Free tier | Easy | Drag-and-drop deploy. Free HTTPS. Good for one-off maps. |
| AWS S3 | Pennies/month | Moderate | Enterprise. Scales to millions of viewers. |
| Google Drive | Free | Tricky | Not recommended — Google blocks iframe embedding from Drive. |
The key requirement is that the URL returns the HTML file with the correct Content-Type header (text/html). Most web servers and static hosting services handle this automatically. Avoid hosting on platforms that add their own wrapper around your file (like Google Drive or Dropbox) as this breaks the map’s JavaScript.
Use Cases for Embedded Maps
Journalism
Visualize crime data, election results, or disaster impact zones. Readers explore their own area without needing separate lookups.
Real Estate
Show property listings, comparable sales, or neighborhood boundaries. Interactive pins let buyers click for details on each listing.
Travel
Plot itineraries, hotel locations, and attractions. Readers zoom into areas they plan to visit and see how locations relate to each other.
Research
Map survey responses, field study sites, or environmental data. Interactive layers let readers toggle between datasets.
Store Locators
Embed a store finder directly in your website. Customers see all locations at a glance and click for directions.
Events
Map conference venues, festival stages, or marathon routes. Attendees plan their day by exploring the map beforehand.
Performance: Handling Large Datasets on Maps
A map with 50 pins loads almost instantly. A map with 5,000 pins needs marker clustering to remain usable. And a map with 50,000 pins needs careful data management to avoid crashing the browser. Here are the thresholds to keep in mind:
- Under 500 pins: No special handling needed. All markers render individually.
- 500–5,000 pins: Enable marker clustering. Nearby pins group into numbered circles that expand on click.
- 5,000–20,000 pins: Use clustering with larger cluster radii. Consider server-side tile generation for the smoothest experience.
- Above 20,000 pins: Switch to a heatmap visualization or load pins dynamically based on the current viewport. Loading all points at once will freeze most browsers.
For most blog and article use cases, you’re working with under 1,000 pins and performance is not a concern. Clustering is built into the CSV2GEO map download, so it handles grouping automatically even for larger datasets.
For Developers: Programmatic Map Generation
If you need to generate maps programmatically, the geocoding API returns coordinates that you can plot using any mapping library. Here’s a minimal example using Leaflet.js:
The API returns JSON with lat/lng fields that plug directly into Leaflet, Google Maps, Mapbox, or any other mapping library. For React applications, consider using react-leaflet or @react-google-maps/api to create map components that update dynamically. The 18 API endpoints cover forward geocoding, reverse geocoding, and batch processing for every use case.
1,000 free API requests per day. Get your key at csv2geo.com/api-keys. CSV2GEO covers 200+ countries with 461M+ addresses, so your maps can include locations anywhere in the world.
Frequently Asked Questions
How do I embed a map in my blog?
Geocode your addresses with CSV2GEO, download the interactive map, host the HTML file, and embed it with an iframe tag. Works on WordPress, Squarespace, Wix, and any HTML-capable platform.
Do I need coding skills to embed a map?
No. The basic workflow (geocode, download map, paste iframe) requires no coding. Customizing pin colors, popups, or clustering does require editing HTML/JavaScript.
How many pins can an embedded map handle?
A few hundred pins render instantly. For 1,000–10,000 pins, marker clustering groups nearby points automatically. Above 10,000, consider filtering to show only the most relevant subset.
Does embedding a map slow down my page?
Not with loading="lazy" on the iframe. The map only loads when readers scroll to it. Without lazy loading, a map with many pins can add 1–2 seconds to initial page load.
Can I embed a map in an email?
Most email clients block iframes and JavaScript. For email, take a screenshot of the map and link it to the hosted interactive version. The reader clicks the image to open the full interactive map.
How do I make the map responsive?
Set width="100%" on the iframe. For height, use a fixed pixel value (400–600px works for most layouts) or use CSS aspect-ratio for truly responsive sizing.
Can I customize pin colors and popups?
Yes. The downloaded map is standard HTML/JavaScript. Edit the marker color, popup content, clustering behavior, base map tiles, and zoom levels directly in the file.
What map providers work with CSV2GEO coordinates?
Any mapping library or service that accepts latitude/longitude coordinates. Leaflet.js, Google Maps, Mapbox, OpenLayers, Maplibre, ArcGIS, QGIS, Tableau, Power BI, and Google Earth all work with CSV2GEO output. The coordinates use standard WGS84 projection (EPSG:4326).
Start Creating Your Map
Ready to embed an interactive map? Upload your addresses, geocode them, download the map, and embed it in your site. 100 rows per day free.
For step-by-step geocoding instructions, see the CSV geocoding guide or the Excel geocoding guide.
Need help? Visit our Help center or contact us.
I.A.
CSV2GEO Creator
Related Articles
Use our batch geocoding tool to convert thousands of addresses to coordinates in minutes. Start with 100 free addresses.
Try Batch Geocoding Free →