Feature 4 Interactive Maps – Map Markers II
Since markers plotted on the map while using the “Interactive Maps” tool at CSV2GEO represent the locations for the geocoded data, features and functionalities available under the “Map Markers” menu in the table of contents go beyond the “Pick Icon” from library and “Filter Value” features. Consequently, the user can analyze values for each marker and the user can track the progress of visited locations on the map. Let’s discover how markers on the map can be marked as visited or how the user can add notes the each marker depending on project requirements.
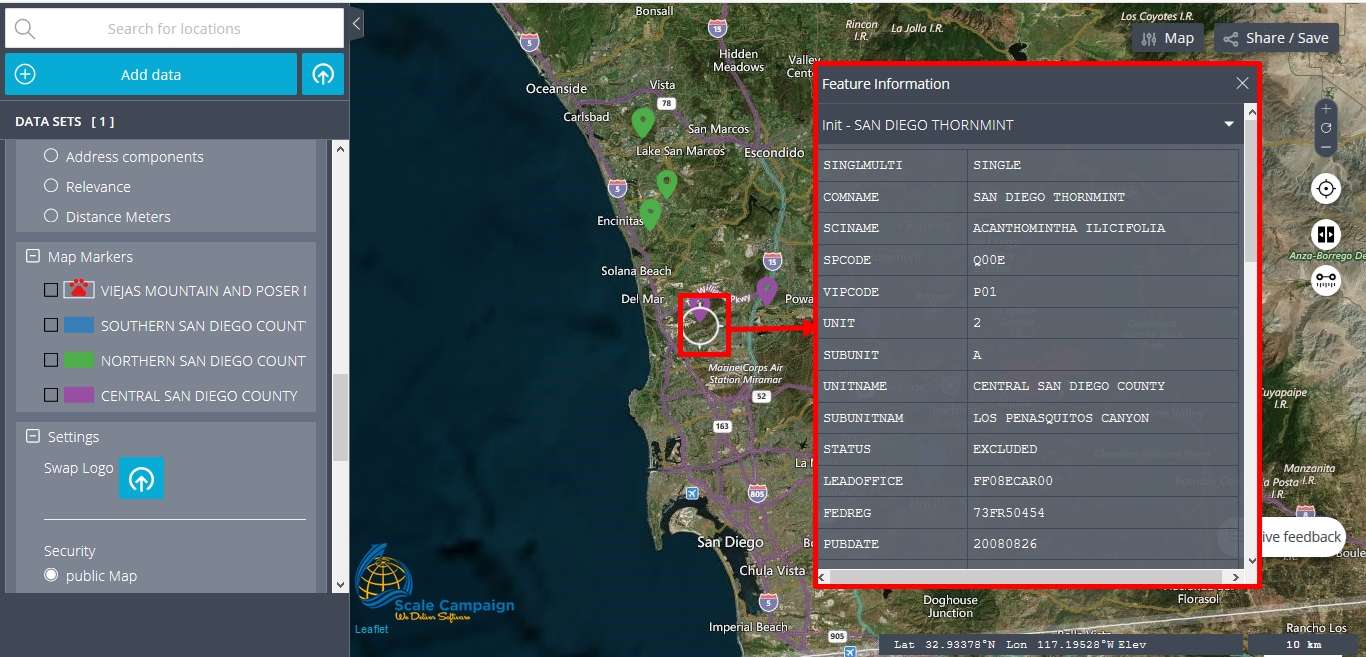
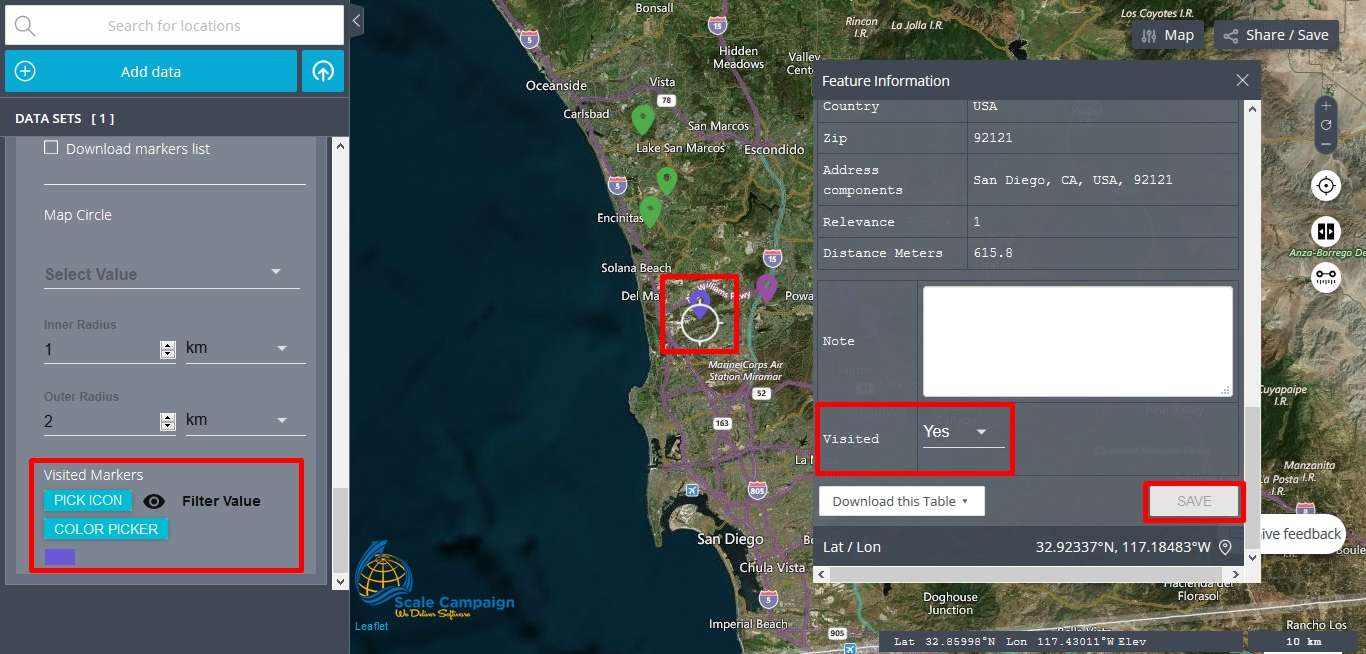
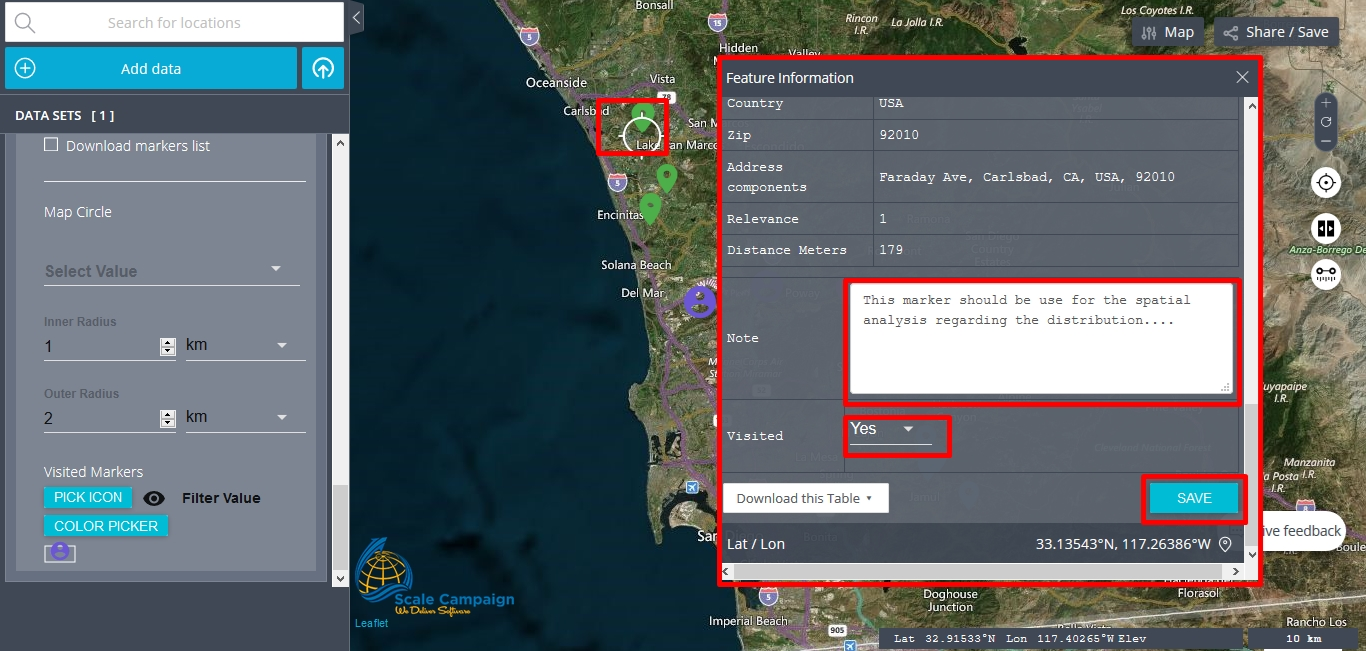
When the user clicks on the map on one marker, a new window will open providing different information regarding that marker. The info includes the values for each column showed in the „Group by Column Value” menu in the table of contents. If the user wants to highlight and to know which of those markers are visited, the user can define the respective marker as visited by changing the “Visited” field in the new window from “NO” into “YES”.
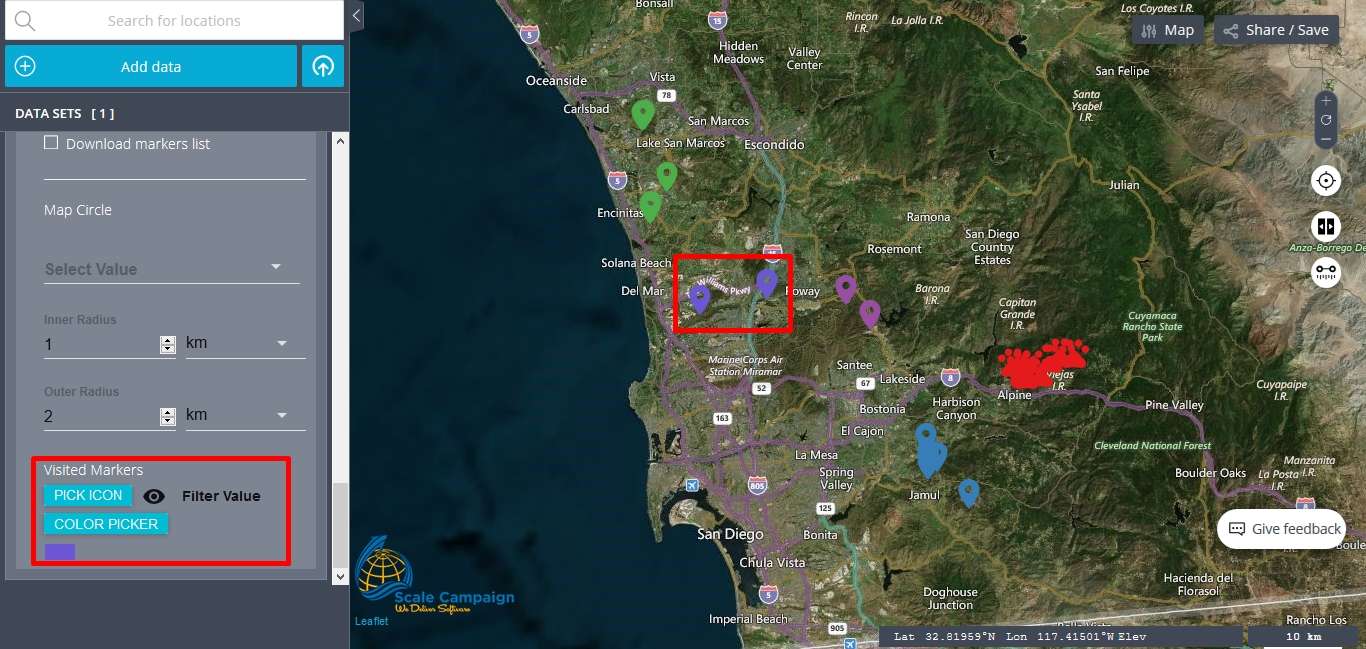
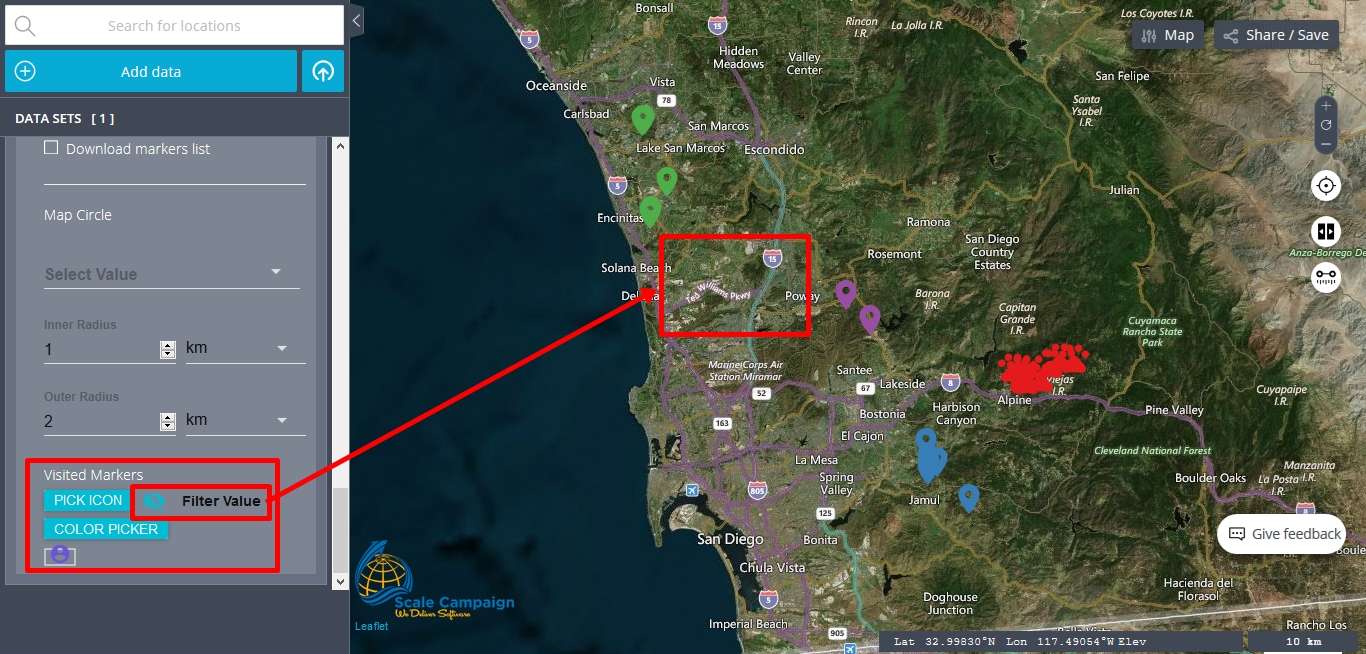
Consequently, visited markers will appear as visited in the table of contents under the “Visited Markers” menu. Moreover, visited markers will change their color on the map and the color will be also shown in the “Visited markers” menu. As soon as more markers are tracked as visited, they will change their color on the map and the user will know that those markers were already visited.
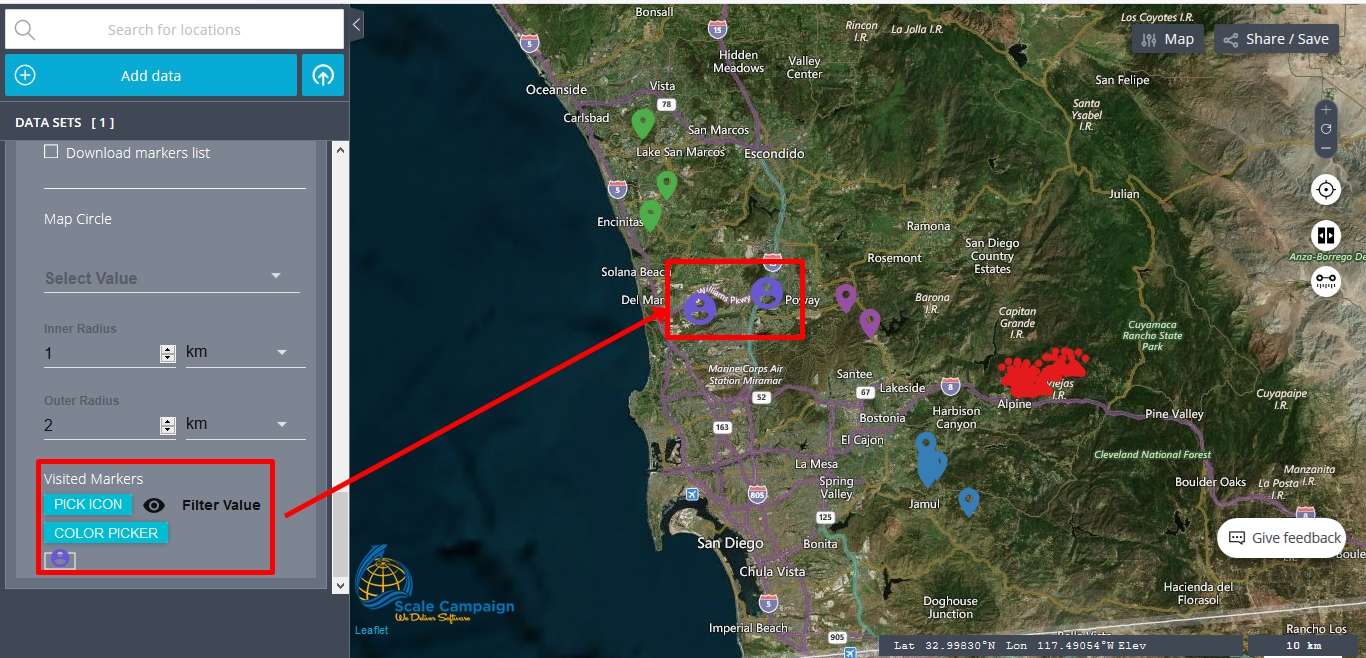
Besides the fact that the markers highlighted as visited are changing their color, the user can also change the icons for visited markers in order to make a clear difference between visited and non-visited markers, but also there is the possibility to use “Filter Value” feature only for the visited markers. However, by doing this, the user will temporary eliminate the visited markers from the map in order to make easier the choice for the non-visited markers.
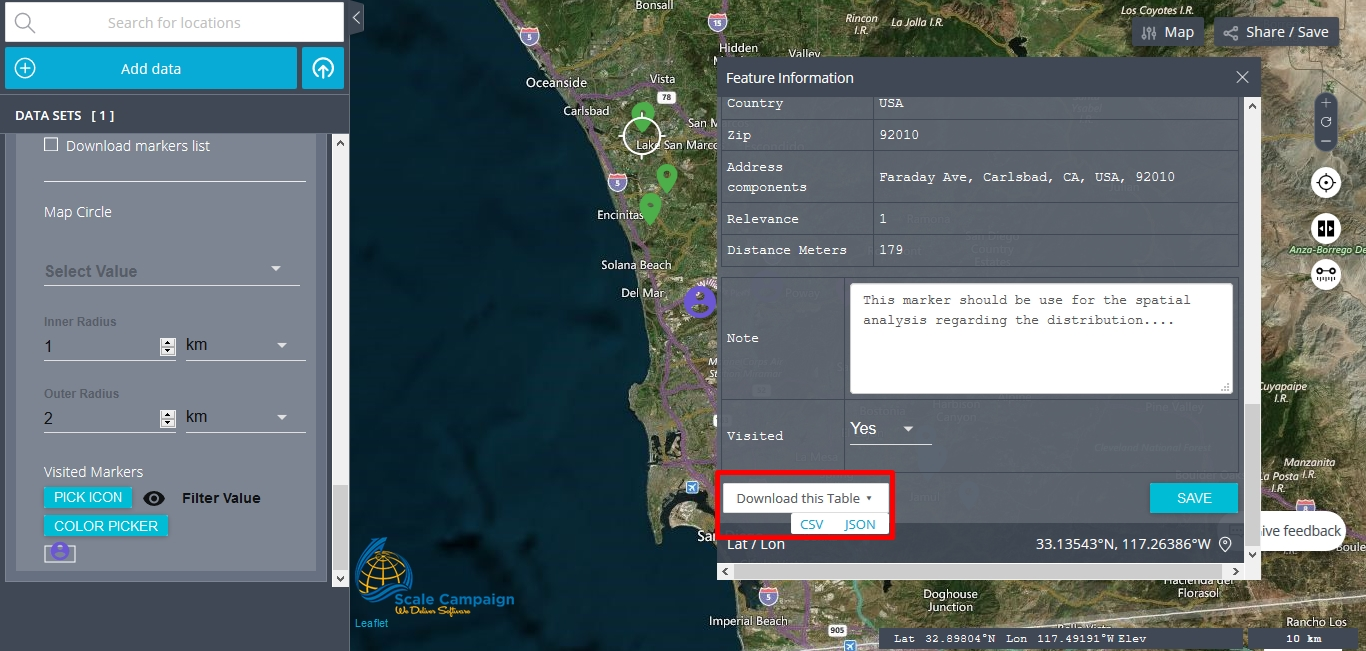
As we have mentioned before, here at CSV2GEO, we have implemented a wide range of features for users who are using the “Interactive Maps” tool in order to create different maps and save these maps as digital maps or maps ready for printing. One more available feature is the possibility to add notes for each one marker. In order to add notes for the markers plotted on the map, the user should click on the marker that is the point of interest and then scroll down the new window that is opening when the marker is clicked on the map. Down below in the new opening window the user can notice the field “Notes”. In this field, the user can add notes that are important for the project or for the spatial analysis developed by the user. Moreover, after the notes are added the user can check the respective marker as visited and then click on the “Save” button in order to save the changes made to that marker. Another feature available in this new window opened for each marker on the map is the button “Download This Table”, which is a feature that allows the user to download the information of the table seen in the “Interactive Maps” tool as CSV or JSON formats. By doing so, the user can use the information saved in the table of attributes after all the changes made in the “Interactive Maps” tool.
We are sure that any user who needs mapping tools in order to create different types of spatial analyses and maps will consider that working with markers on the map here at CSV2GEO is very helpful and useful. Moreover, using “Map Markers” menu and map markers feature is very easy for both experts and non-experts. On the other hand, using these features while working with markers at CSV2GEO allows the user to create custom maps in order to achieve the expected final products.