How to Make a Map?
Maps are used since the ancient times in various ways. During the time maps have changed constantly as a result of progress in technology. However, modern maps are mostly in digital form and many of them are interactive maps. Nowadays, maps are present in our lives every day as part of different applications that we use daily on our smart phones, tablets and laptops. Moreover, if in the past only cartographers could create and work with maps, currently anyone uses maps in different purpose and almost anyone can create maps using different friendly platforms and just few clicks may help you to obtain a custom map.
From latitude and longitude to zip postal code address and vice-versa
Any point on the earth surface is defined by a mathematical location defined by latitude and longitude. Nevertheless, at the same time, people has introduced zip postal code address for locations in human communities in order to make easier the process to find a certain location since decades ago was very difficult to find out a numeric location defined by latitude and longitude since the GPS was not available or it was available only for some people working in military field. Consequently, if the postman would have a letter for you, he should find out your location based on a certain postal address.
Currently, the development of Geographic Information System (GIS) and Location Intelligence (LI) has changed the role of maps since the location is a core feature of our lives. Maps are not anymore used exclusively by experts. However, maps are used by millions or even billions of people all over the world. Additionally, the implementation of GIS has allowed the increase of interactive maps and in the backstage of these kinds of maps there are many processes that help the user to have access to large amount of data in real time. Furthermore, since location defines any map it is highly important to know that in order to have a point on an interactive map the geographic coordinates of that point must be added and also the zip postal code address. In the field of GIS, these processes are known as geocoding and reverse geocoding.
Geocoding is the process that converts the address to coordinates, meaning that you get latitude and longitude from address. On the other hand, the reverse process, called reverse geocoding is the process that transforms Latitude and Longitude to address. Since these processes are used in different applications with interactive maps in domains like tourism, natural disaster management, public safety, business locations and traffic management, it is highly important to be able to geocode address or transform latitude longitude to address fast and accurate.
Use CSV2GEO to create interactive maps
Here is where CSV2GEO intervenes and brings the opportunity to geocode address and convert latitude longitude to address very quick and extremely accurate. At CSV2GEO in just few clicks you are able to get latitude and longitude from address or transform Latitude and Longitude to address. Moreover, if you have more locations at once for which you need to get latitude and longitude from address, then you should know that CSV2GEO allows you to run a batch geocoding process. Recently, at CSV2GEO a new feature has been implemented, namely “Create Interactive Map”.
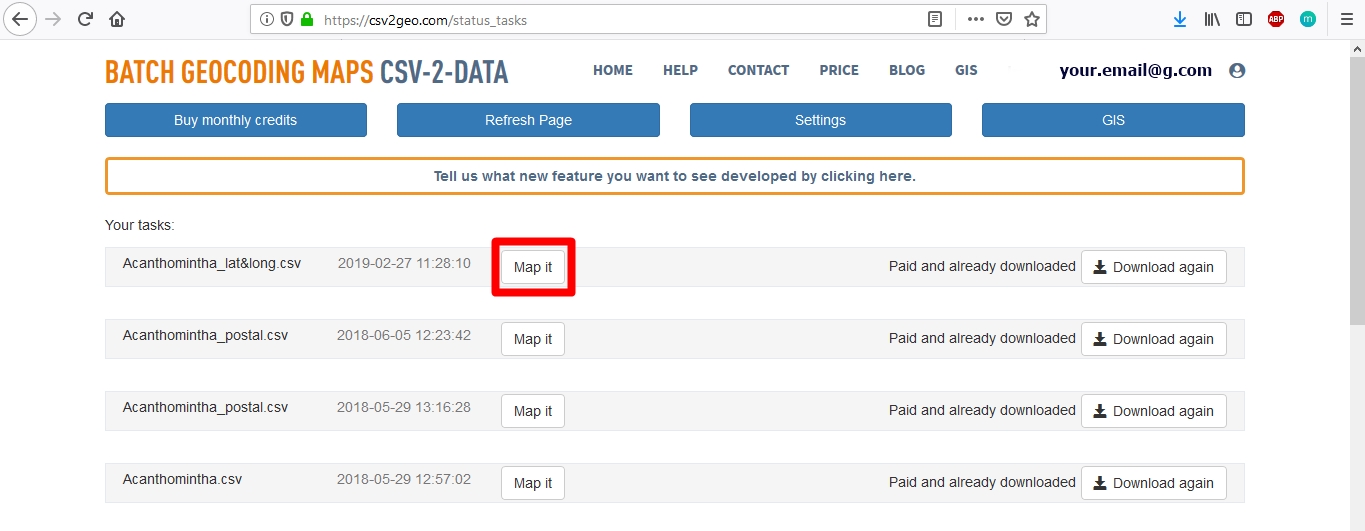
By using “Create Interactive Map” feature, anyone can plot on an interactive map data previously geocoded or reverse geocoded. The first step in creating an interactive map with CSV2GEO is to run geocoding or reverse geocoding processes. After you have your data obtained from address to coordinates or latitude longitude to address, you may create a custom map with your data. In order to create an interactive map at CSV2GEO, you just need to get latitude and longitude from address or to transform Latitude and Longitude to address and then you should use the button “Map It” that is available on the same page with “Download” button.
How “Create Interactive Map” feature work?
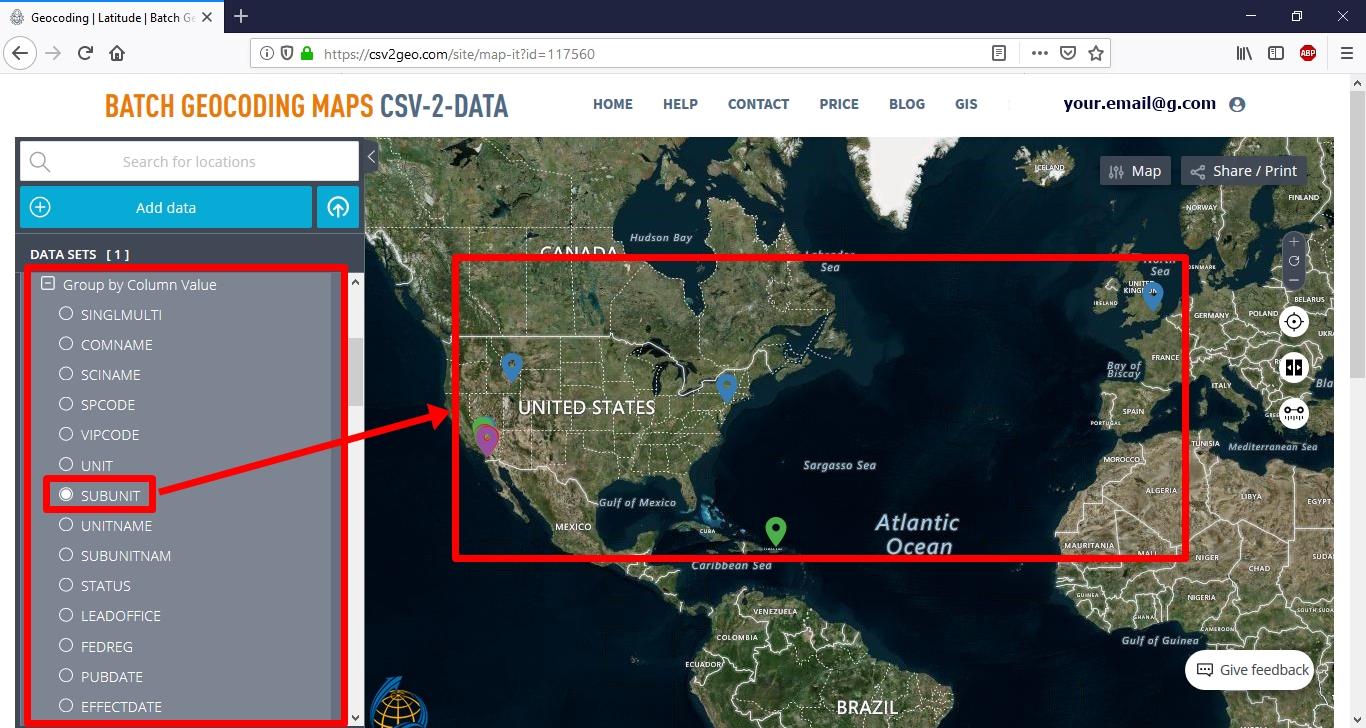
Using “Create Interactive Map” tool available at CSV2GEO means more than only have your data sets plotted on a virtual map. However, you can filter your data using different attributes that define your data, you may group your data sets using again certain values or you can choose markers on the map that you can visit. Grouping your data on the map can be done using all the attributes available in the table of attributes of your csv file that you have used for geocode address.
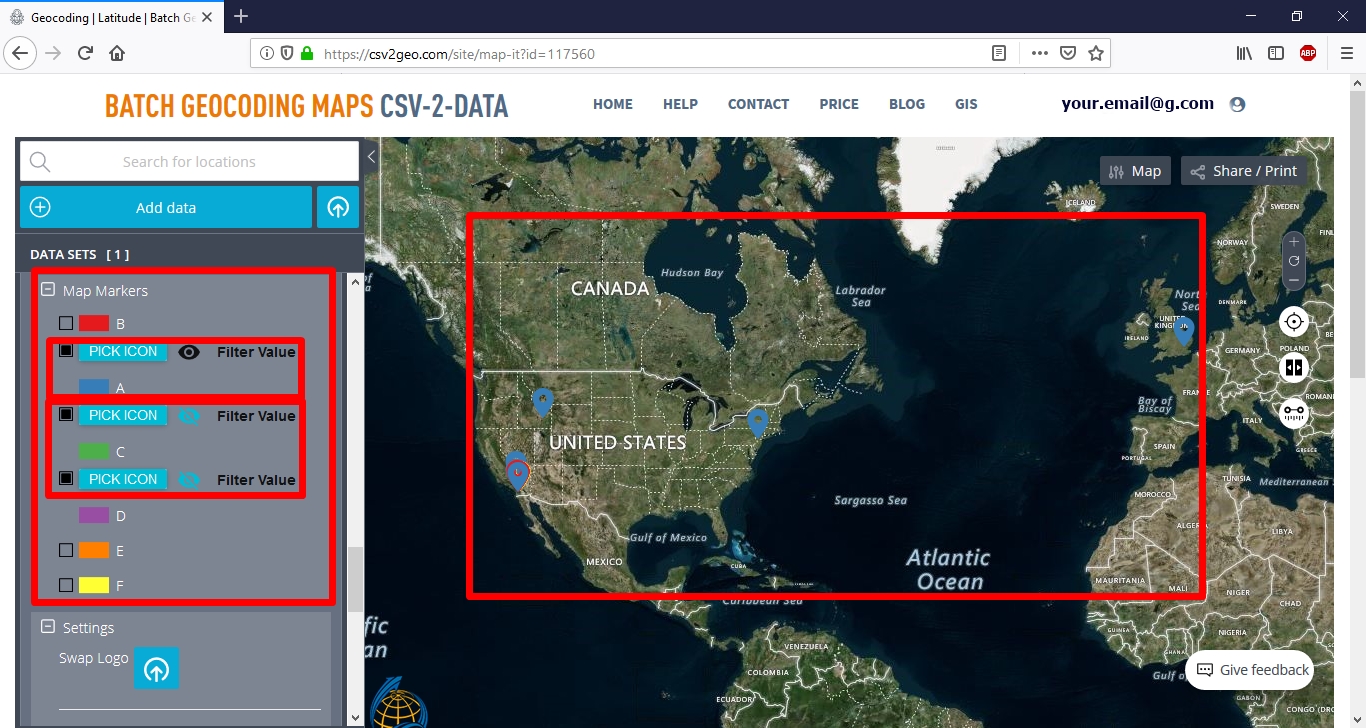
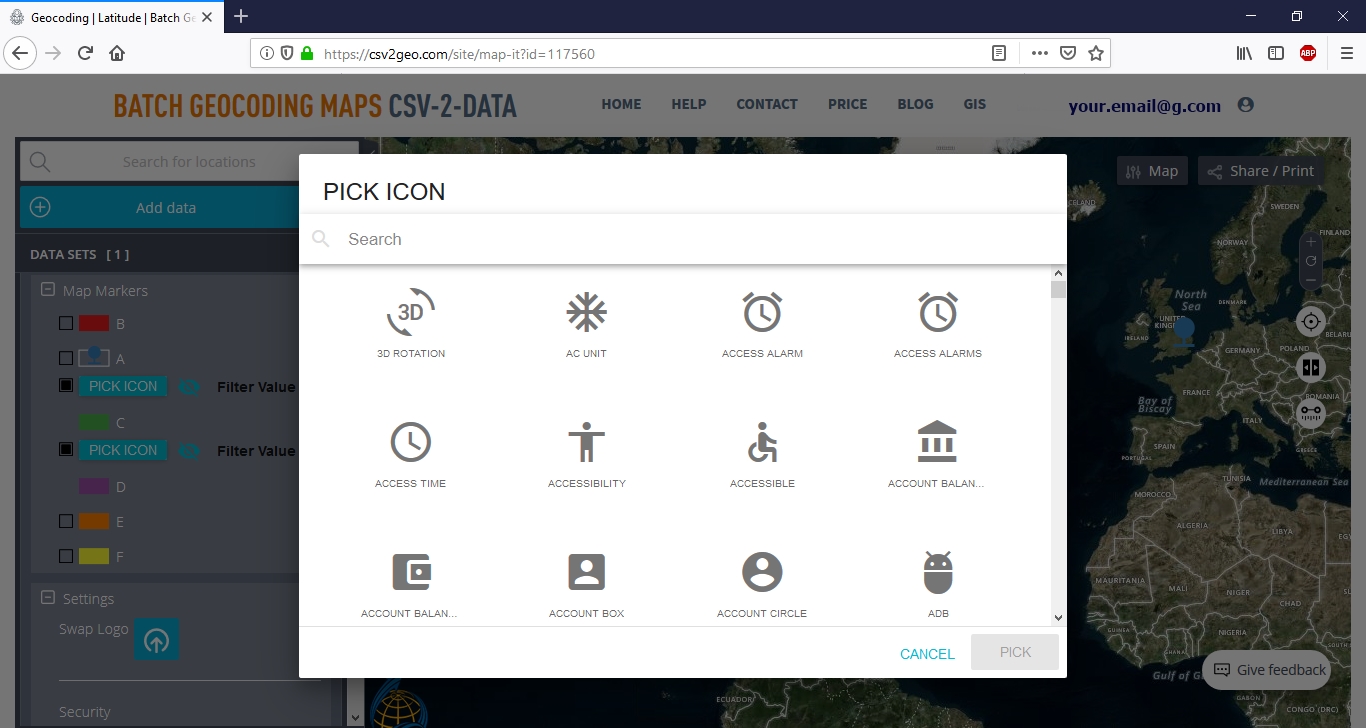
Furthermore, as soon as your data is grouped, you can go deeper with your analysis and filter which groups of data may be seen visible or not. Moreover, filtering allows you to change the symbol for your data by clicking on “Pick Icon” button. And then you may search for the symbol that matches with your data which is represented on the map.
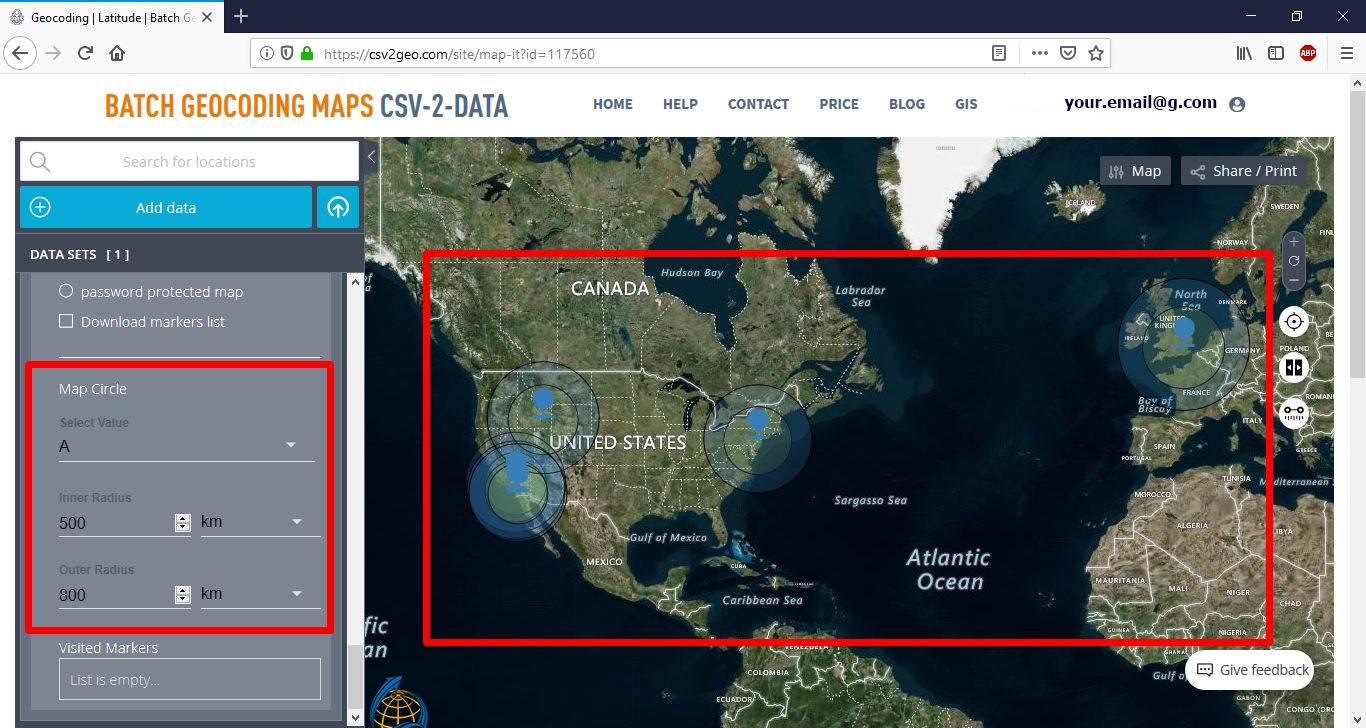
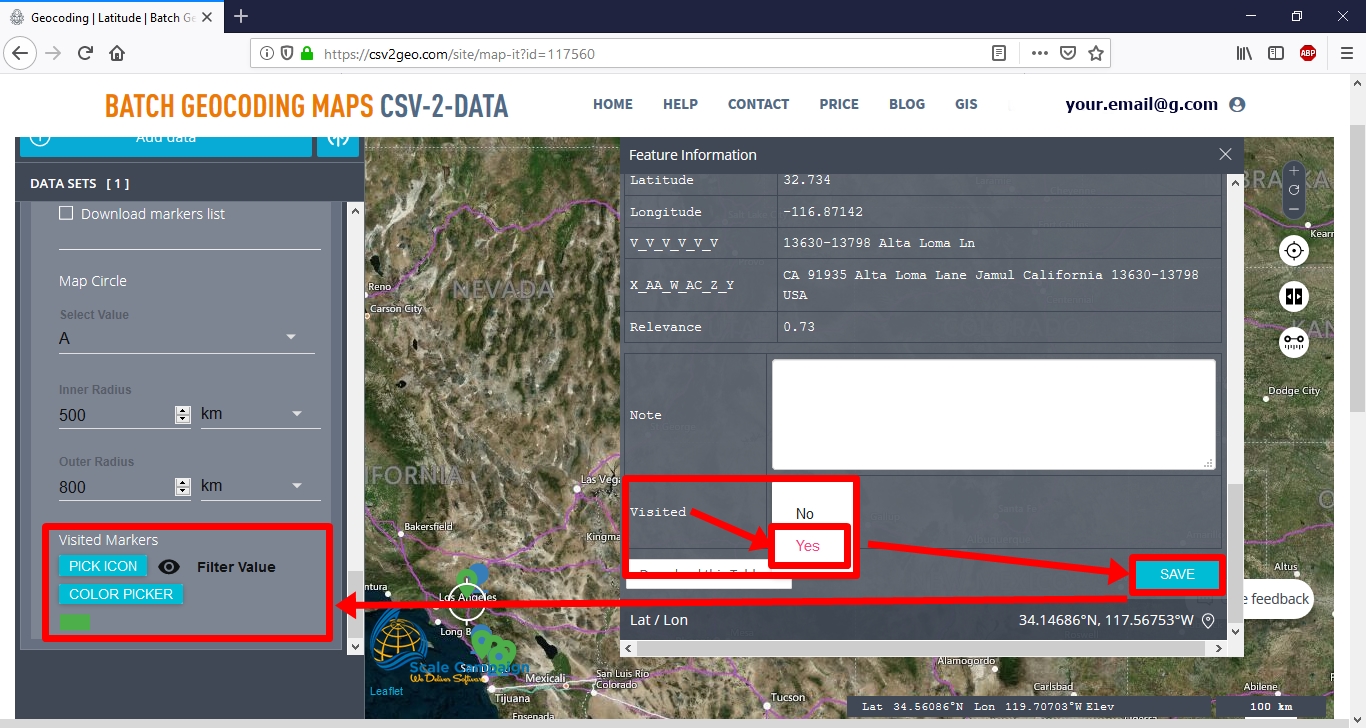
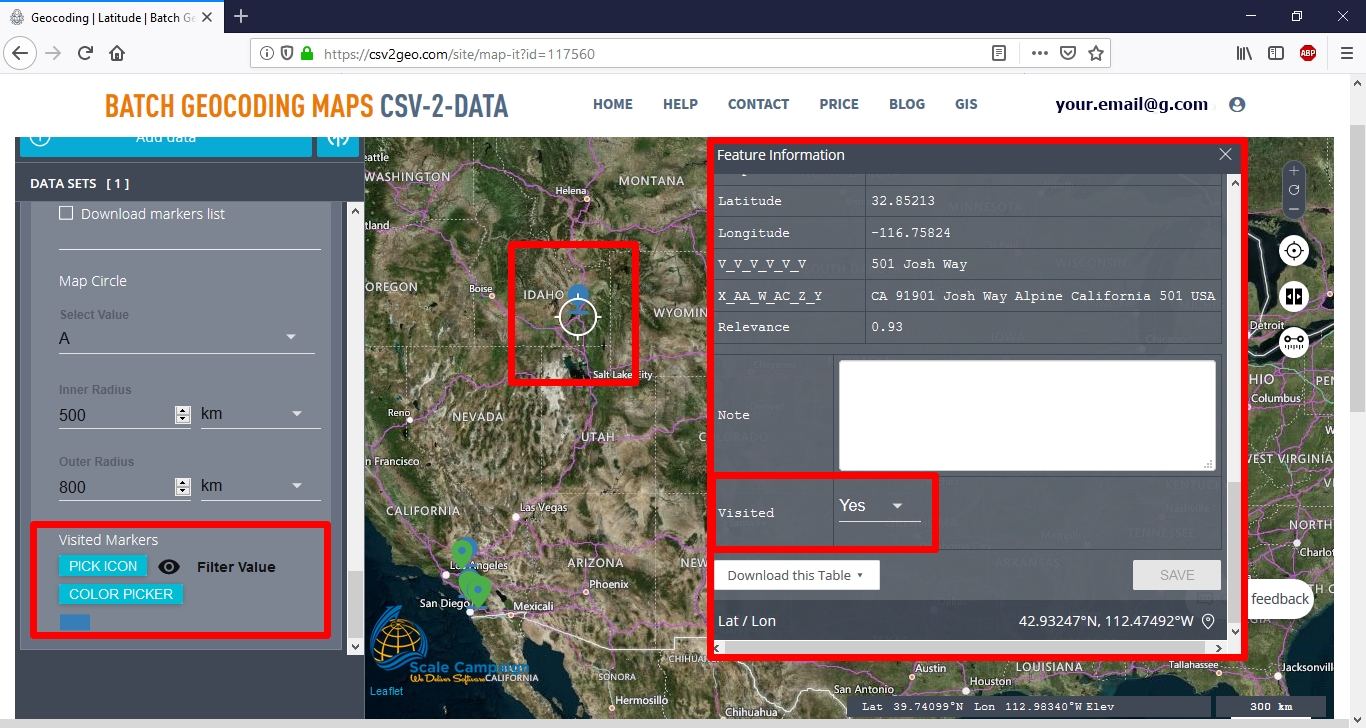
However, other great tools available with this interactive map feature at CSV2GEO include the possibility to create buffer zones as circles with different radius (you may choose the unit measurement), but also the option to highlight which ones of your markers plotted on the map where visited. In order to do this, you should click on one marker on the map and then at the table that is opening you will find the field “Visited” down below and you may choose “Yes” and then “Save”. Consequently, in the left table of contents of your map you will notice that the marker marked as “Visible” will appear there in the “Visited Markers” section.
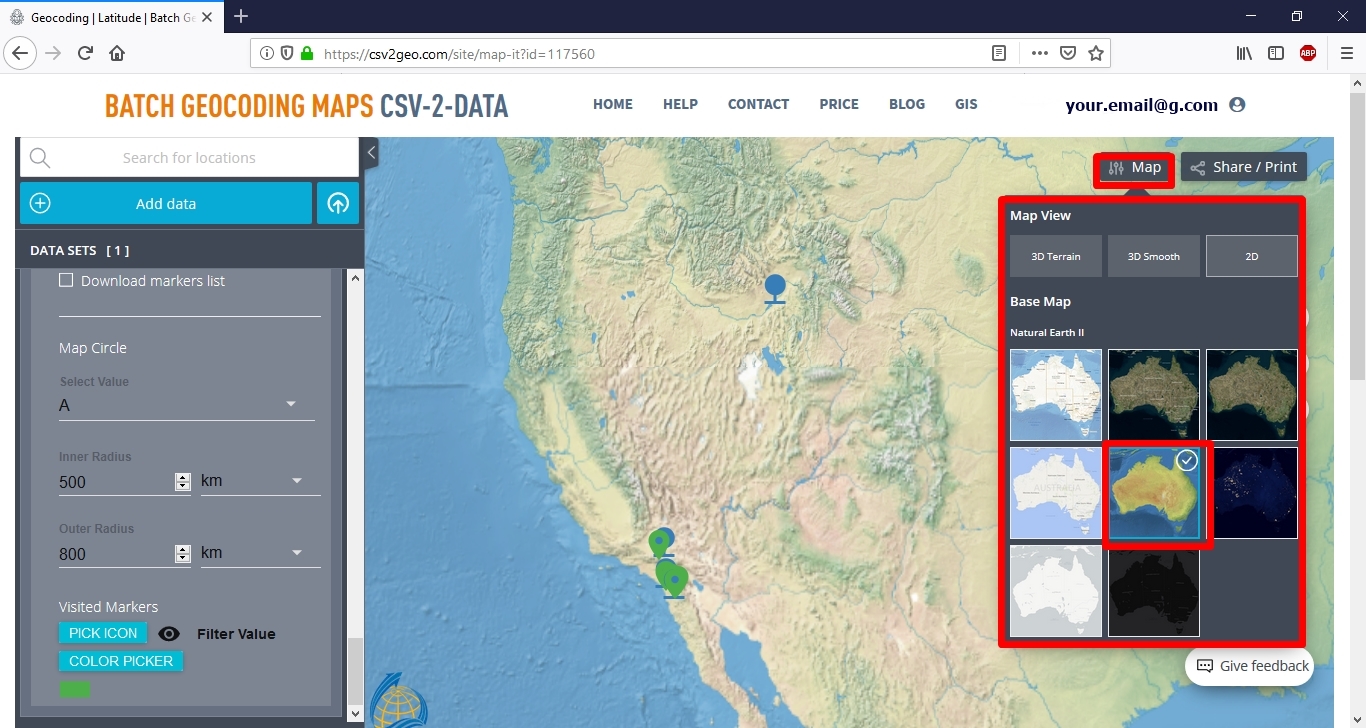
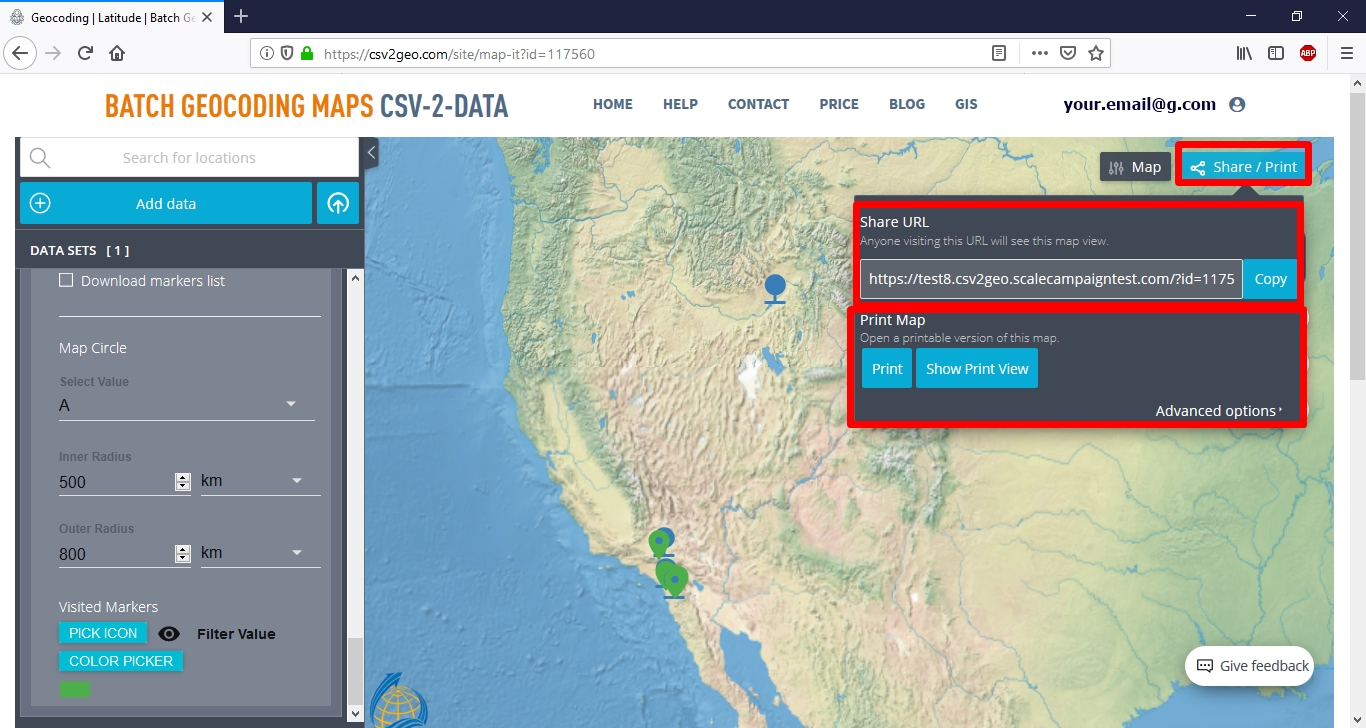
Another fantastic feature that can help you display your data after converting it from an address to coordinates or from latitude longitude to address is the possibility to change your base map from aerial images into natural terrain. Additionally, as soon as you have completed all your analyses on this interactive map and grouping and filtering actions are done, you can choose to share your map as a link or you can print it as a JPEG image for different purpose.
Conclude remarks
Since interactive maps are very common in the digital era that we live nowadays, at CSV2GEO you can find an user-friendly and complex feature to create your own maps after geocoding and reverse geocoding your data sets. Whatever your domain of activity is, at CSV2GEO you may get latitude and longitude from address or convert latitude longitude to address very easy, in a very short time and you may use the obtained data to create your custom map. All the functionalities and tools available within “Create Interactive Maps” feature at CSV2GEO may be extremely helpful in different kinds of pattern analyses, spatial analyses and visualization of diverse events. Choose ScaleCampaign in order to have access to geocoding, batch geocoding and reverse geocoding processes and create custom maps tool on the same platform.